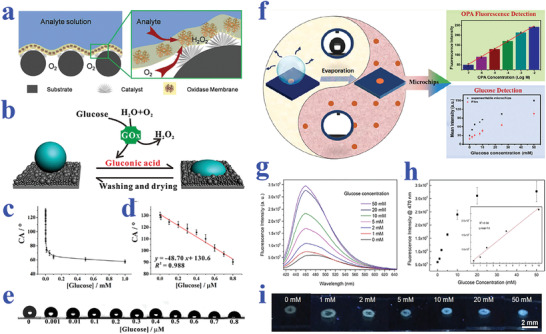
Figure 10.

a) Schematic diagram of the superhydrophobic three‐phase biosensor: the electrode that modified with H2O2 catalyst is coated with an oxidase/chitosan layer. Reproduced with permission.[ 191 ] Copyright 2015, Wiley‐VCH. b) Schematic illustration showing the reversible wettability transition of the substrate that caused by pH variation from GOx‐catalyzed reaction. c) Relationship between glucose concentration (from 1 nm to 1 mm) and CA values. d) Linear relationship between CA and glucose concentrations (from 1 nm to 800 nm). e) Wetting performances of droplets on the substrate under different glucose concentrations. b‐e) Reproduced with permission.[ 193 ] Copyright 2018, Springer Nature. f) Illustration of superwettability‐patterned microchips for the detection of o‐phthalaldehyde and glucose. Reproduced with permission.[ 194 ] Copyright 2019, American Chemical Society. g) Fluorescence spectra of evaporated droplets containing glucose of different concentrations on microchips. h) Relationship between fluorescence intensity at 470 nm and concentration of glucose. i) Fluorescent images of evaporated droplets containing glucose in fluorescent polydopamine (PDA) spots. g‐i) Reproduced with permission.[ 195 ] Copyright 2018, American Chemical Society.
