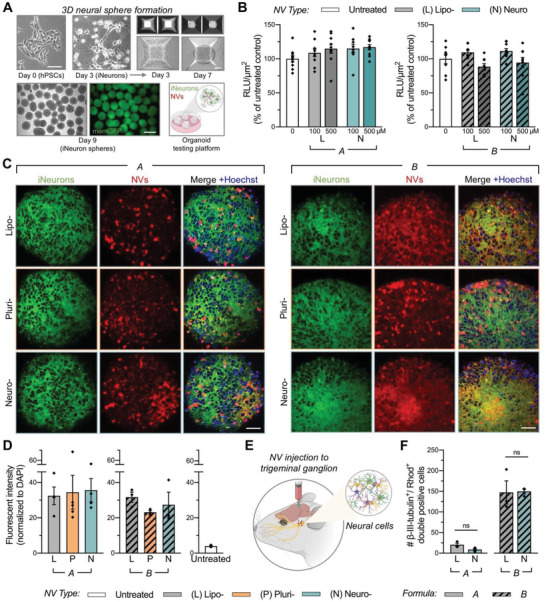
Figure 3.

Cytotoxicity and association of humanized NVs within 3D model systems. A) Large‐scale production of 3D neural spheres was achieved by culturing differentiated, hPSC‐derived iNeurons in microwell plates. These organoid‐based spheres were utilized as a humanized testing platform for NVs. Scale: 100 µm (top) and 500 µm (bottom). B) Cell viability of iNeurons cultured in 3D spheres and treated with NVs from lipid formulation A (left) or B (right) at 100 or 500 × 10−6 m for 24 h, as determined by a CellTiter‐Glo 3D Assay. Outliers were identified and removed using the ROUT method (based on maximum false discovery rate Q = 1%) in GraphPad Prism. Relative luminescence units (RLU) were normalized to sphere cross‐sectional areas and untreated control spheres (n = 8–10 spheres per group). In subsequent experiments, 3D spheres were treated with 500 × 10−6 m NVs from both formulations A and B. C) Qualitative analysis of maximum projections images from z‐stacks demonstrated association of rhodamine labeled NVs (from both formulations A and B) with iNeurons in 3D spheres. Scale: 50 µm. D) NV association was quantified by assessing the raw integrated density of the rhodamine signal in maximum projection images, normalized to nuclear signal within each sphere (n = 3–5 spheres per group). E) NB and LB were administrated to the left trigeminal ganglion of C57BL/6 mice. Tissue samples were collected and processed for FACS analysis 24 h post‐treatment. F) FACS analysis indicated similar levels of association between neurons and NVs (liposomes and neurosomes) for both lipid formulations A and B, as assessed by double‐positive signal of rhodamine (NVs) with fluorescently labeled beta‐III tubulin (n = 3 mice per group of NVs). For (B), (D), and (F), results are shown as mean ± SEM. For (D) and (F), significance was determined using a two‐tailed unpaired t‐test between neurosomes and liposomes in formulations A and B for in vivo FACS experiments, with *p < 0.05.
