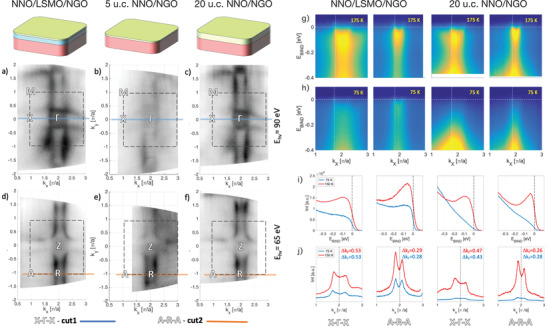
Figure 2.

Fermi surfaces (FSs) at high temperature (T = 150 K). a–c) FSs measured at hν = 90 eV (k z ≈ 0) and d–f) hν = 65 eV (k z ≈ π) for NNO/LSMO, thin‐NNO/NGO, and thick‐NNO/NGO, respectively. Although the 5 u.c. NNO/NGO system is a strong insulator, we have been able to perform the ARPES measurement but only at high temperature. The photoemission intensity has been integrated over ±20 meV. The dashed square represents the zone boundary. The solid lines (blue on (d–f) and orange on (g–i)) represent the direction of high statistic cuts. g) Cut#1 along the X–Γ–X, and h) cut #2 along A–R–A directions from NNO/LSMO/NGO and thick‐NNO/NGO. Vertical dashed lines in (g,h) indicate the k F positions where the EDC cuts were taken, shown in (i). Horizontal dashed lines in (g,h) indicate the position of the Fermi level and MDC cuts shown in (j).
