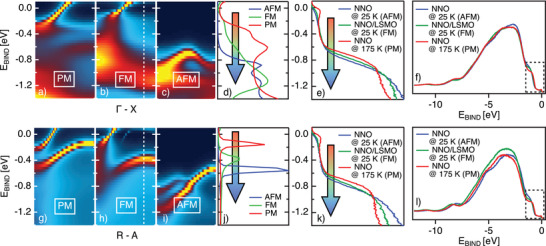
Figure 3.

Calculated bend structure for NNO system in the a,g) PM, b,h) FM, and c,i) AFM phase along the Γ‐X and R‐A directions. d,j) Display the EDCs integrated at the zone boundary ((the range is indicated with the white box) of the calculated band structures for all three magnetic phases along with the Γ–X and R–A directions. e,k) The corresponding experimental spectra (EDCs) integrated at the zone boundary for the thick‐NNO sample at 175 K, and for NNO/LSMO and thick‐NNO sample at 20 K. The whole integrated VB at the zone boundary for all three samples are in (f, l). Blue boxes in those panels symbolize the zoom‐in shown in (e,k). Experimental spectra are directly comparable with the calculated and depict experimentally obtained EDCs of NNO in the PM, FM, and AFM phases.
