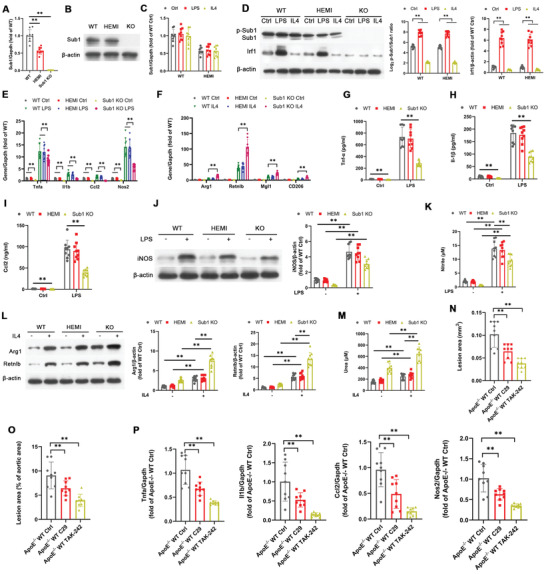
Figure 2.

TLR2 and TLR4 signaling activates M1‐skewing Sub1 in murine macrophages in vitro and atherosclerosis in vivo. A–M) Bone marrow‐derived macrophages (BMDMs) isolated from Sub1 flox/flox (wild‐type, WT), LysM Cre/−/Sub1 flox/wt (hemizygous, HEMI), and LysM Cre/−/Sub1 flox/flox (knockout, KO) mice were stimulated with vehicle (Ctrl), Pam (100 ng mL−1, 8 h), LPS (100 ng mL−1, 8 h), or IL4 (5 ng mL−1, 8 h). A) qPCR of Sub1 mRNA levels. B) Immunoblotting of Sub1 protein levels. C) qPCR of Sub1 mRNA expression. D) Immunoblotting of Sub1, p‐Sub1, and Sub1's downstream target Irf1. Densitometric quantification of the p‐Sub1/Sub1 ratio and Irf1 protein expression. E) qPCR of M1 marker genes. F) qPCR of M2 marker genes. ELISA of G) Tnf‐α, H) Il‐1β, and I) Ccl2 secretion. J) Immunoblotting of iNOS protein expression and K) nitrite‐based iNOS activity. L) Immunoblotting of Arg1 and Retnlb protein expression and M) urea‐based Arg1 activity. N–P) ApoE −/−; Sub1 flox/flox (ApoE −/− WT) mice were fed a chow diet and administered vehicle (Ctrl), C29 (50 mg kg−1), or TAK‐242 (3 mg kg−1) by daily intraperitoneal (i.p.) injection for 14 weeks. n = 9 mice per group. N) Quantification of aortic root lesion areas based on 8–12 10 µm sections per mouse (30 µm apart). Scale bar = 200 µm. O) Quantification of total lesion areas in en face aortas. Scale bar = 1 cm. P) qPCR of M1 marker genes in isolated aortic root plaque macrophages. Data reported as means ± SDs. In vivo experiments: n = 9 mice per group. In vitro experiments: n = 3 biological replicates × 3 technical replicates. *p < 0.05 and **p < 0.01 (A,O–P: one‐way ANOVA with Fisher's LSD; C–M: two‐way ANOVA with Fisher's LSD; comparing n = 3 in vitro biological replicates per group or n = 9 mice per group).
