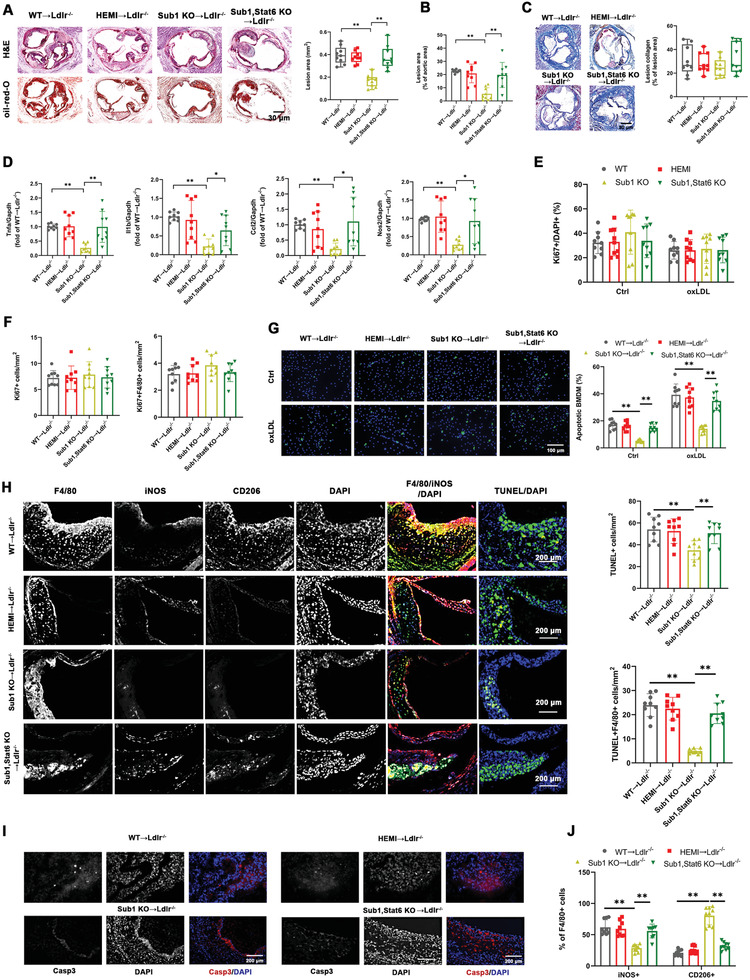
Figure 6.

Transplantation of Sub1 knockout macrophages reduces Western diet‐induced atherosclerosis in Ldlr −/− recipient mice. Irradiated Ldlr −/− mice transplanted with bone marrow from Sub1 flox/flox mice (WT→Ldlr −/−), LysM Cre/−/Sub1 flox/wt mice (HEMI→Ldlr −/−), LysM Cre/−/Sub1 flox/flox mice (Sub1 KO→Ldlr −/−), or LysM Cre/−/Sub1 flox/flox; Stat6 −/− mice (Sub1, Stat6 KO→Ldlr −/−) were fed a Western diet for 12 weeks. A) Representative H&E and Oil Red O staining images showing lesion areas in aortic root sections. Scale bar = 200 µm. Quantification of aortic root lesion areas based on 8–12 10 µm sections per mouse (30 µm apart). B) Quantification of total lesion areas in en face aortas. C) Representative Masson's trichrome staining images and quantification of aortic root lesion collagen by Zeiss Axiovision software. Scale bar = 200 µm. D) qPCR of M1 marker genes in isolated aortic root plaque macrophages. E) In vitro bone marrow‐derived macrophages (BMDMs) proliferation under vehicle (Ctrl) or oxLDL (50 µg mL−1, 24 h) conditions and F) in vivo F4/80+ macrophage proliferation in aortic root lesions examined using anti‐Ki67 immunofluorescence. Scale bar = 100 µm. G) In vitro BMDM apoptosis levels under vehicle (Ctrl) or oxLDL (50 µg mL−1, 24 h) conditions assessed by TUNEL staining. Cell morphology analyzed by differential interference contrast (DIC) and nuclear staining by DAPI. Apoptotic cell percentage expressed as ratio of TUNEL+/DAPI+. Scale bar = 100 µm. n = 9 fields per group. H,I) In vivo F4/80+ macrophage apoptosis in aortic root lesions examined by TUNEL and cleaved caspase‐3 staining. Scale bar = 100 µm. J) Immunofluorescent staining analysis of M1 macrophages (iNOS+/F4/80+) and M2 macrophages (CD206+/F4/80+) in serial aortic root lesion sections. Data reported as means ± SDs. In vivo experiments: n = 9 mice per group. In vitro experiments: n = 3 biological replicates × 3 technical replicates. *p < 0.05 and **p < 0.01 (A–D,F,H,J: one‐way ANOVA with Fisher's LSD; E,G: two‐way ANOVA with Fisher's LSD; comparing n = 3 in vitro biological replicates per group or n = 9 mice per group).
