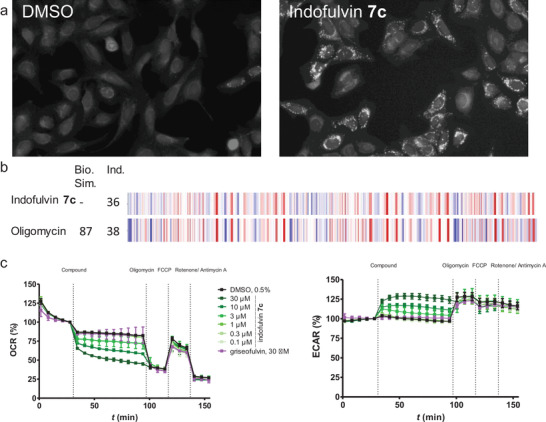
Figure 8.

Influence of indofulvin 7c on mitochondrial respiration. a) MitoTracker images for U‐2OS cells after treatment with 10 × 10−6 m indofulvin 7c for 24 h. b) Morphological fingerprints of 7c and Oligomycin. The biological similarity (Bio. Sim.) is in reference to 7c. Induction (Ind.) as percentage of significantly changed features over DMSO control. Blue: decreased parameter, red: increased parameter. c) Influence of indofulvin 7c on mitochondrial respiration in MCF7 cells. The assay was performed in a Seahorse XFe96 Analyzer, and oxygen consumption rate (OCR) and extracellular acidification rate (ECAR) were measured time‐dependently. Data are mean values ± SD, n = 3.
