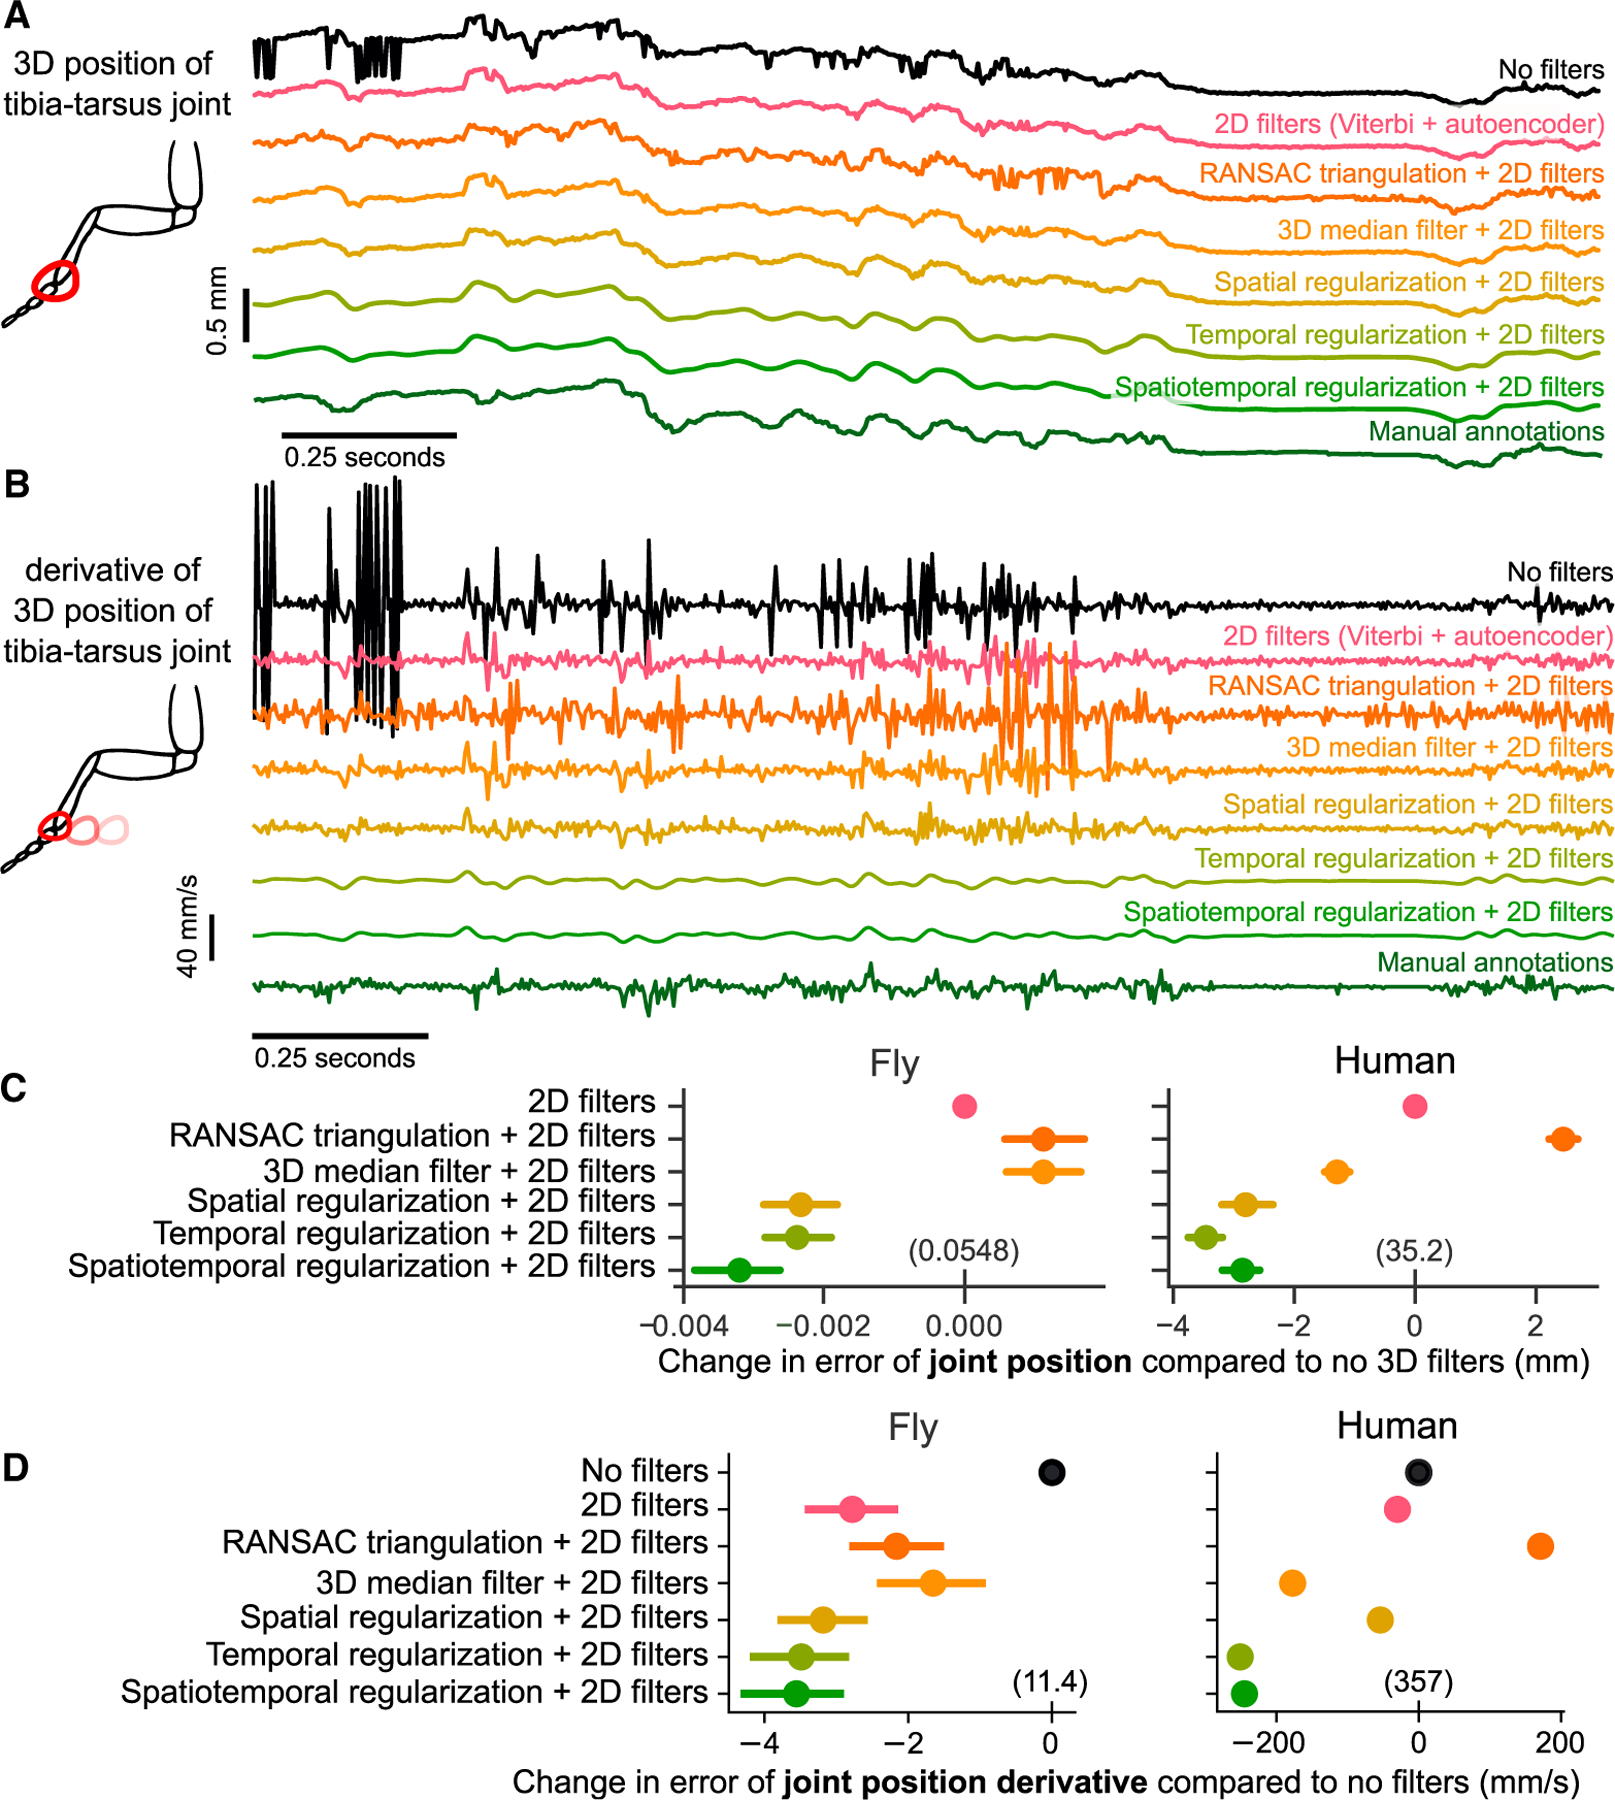
Figure 5. Spatiotemporal filters further improve 3D pose estimation.

See Figure S3 for example angle and segment length traces with different filters. See Figure S4 for detailed evaluation of temporal regularization on a synthetic dataset.
(A) An example trace of the tracked 3D position of the fly tibia-tarsus joint, before and after filtering. To plot a single illustrative position value, the 3D x-y-z coordinate is projected onto the longitudinal axis of the fly. Also included are comparisons with standard 3D filtering algorithms RANSAC and a 3D median filter, along with manual annotations. Filtering leads to reduction of sudden jumps and keypoint jitters, even compared to 2D filters alone.
(B) An example trace of the derivative of the 3D position of the fly tibia-tarsus joint, before and after filtering. To plot a single illustrative derivative value, the 3D x-y-z joint coordinates is projected onto the longitudinal axis of the fly. Spatiotemporal regularization produces smooth derivative estimates, which are closer to the manual annotations compared to other filtering approaches.
(C) Comparison of error in joint position before and after filtering. The mean difference in error for the same tracked points is plotted, along with the 95% confidence interval. The absolute error values are indicated in parentheses above the 0 tick mark for each dataset. The 2D filters are the Viterbi filter followed by the autoencoder for the fly dataset and Viterbi filter alone for the human dataset. Spatiotemporal regularization improves the estimation of joint position significantly above 2D filters in both datasets (p, 0.001, paired t test). The 3D median filter improves pose estimation on the human dataset (p, 0.001, paired t test) but not on the fly dataset. RANSAC triangulation does not improve pose estimation for either dataset. For the fly dataset, 1 pixel corresponds to 0.0075 mm. For the human dataset, 1 pixel corresponds to 4.8 mm.
(D) Comparison of error in joint position derivative before and after filtering. The mean difference in error for the same tracked points is plotted, along with the 95% confidence interval. The absolute error values are indicated in parentheses above the 0 tick mark for each dataset. The 2D filters are the Viterbi filter followed by the autoencoder for the fly dataset and Viterbi filter alone for the human dataset. For the human dataset, due to the large number of labeled points, the confidence intervals are smaller than the size of the points. Adding filters significantly improves the estimate of the derivative.
