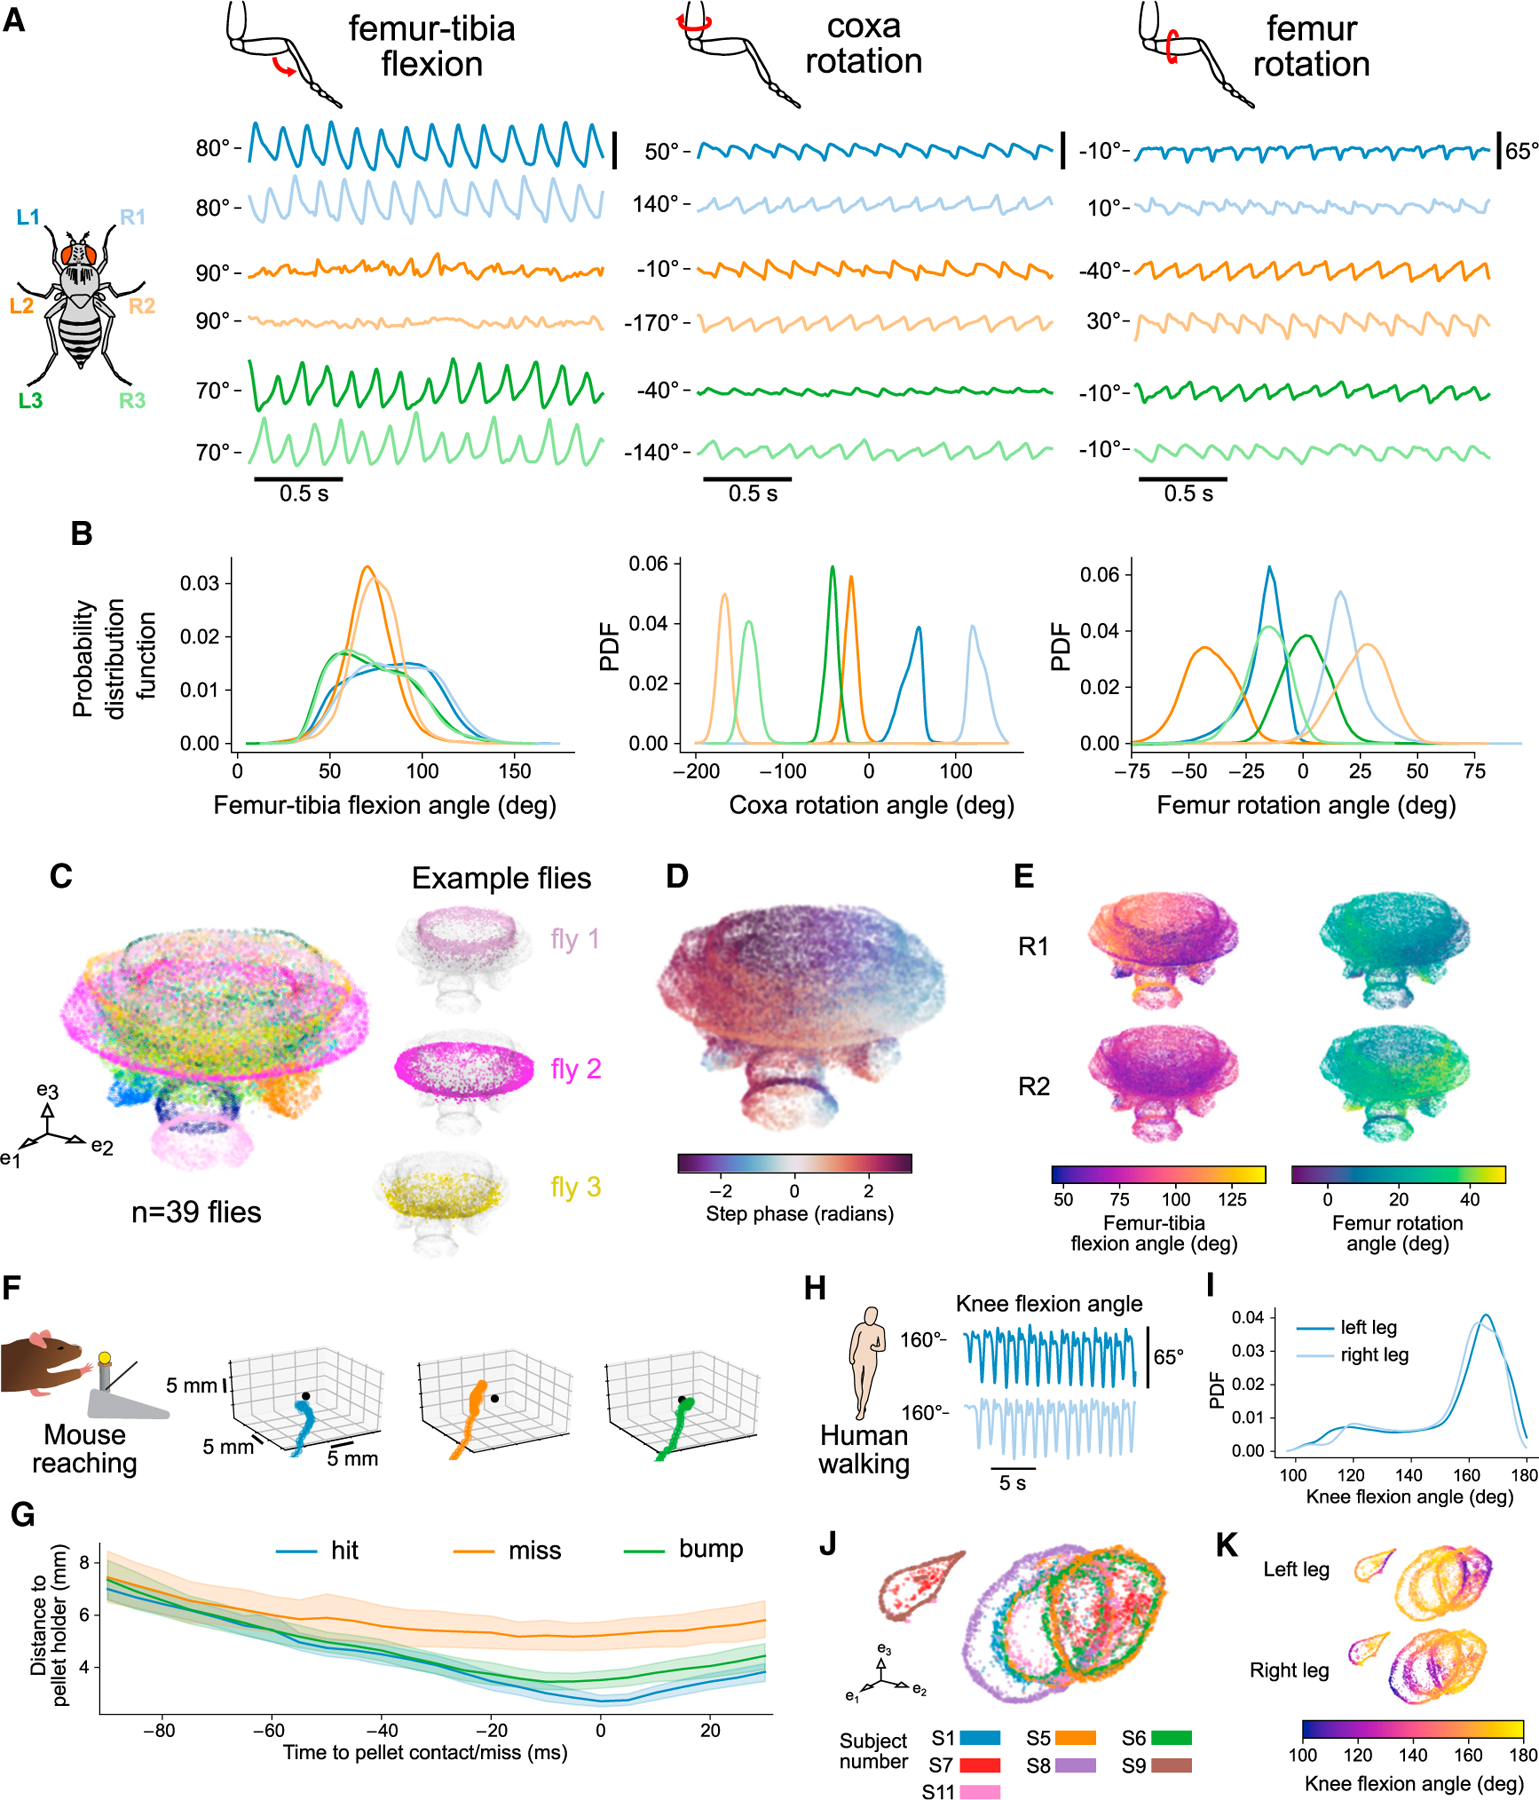
Figure 7. 3D tracking of fly walking reveals difference in rotation and flexion angles across legs.

3D tracking enables quantification of fly, mouse, and human joint position and angles to reveal structure in behavior.
(A–E) 3D tracking of fly walking reveals difference in rotation and flexion angles across legs. See Figure S6 for analyses across all angles.
(A) Representative traces of coxa rotation, femur rotation, and femur-tibia flexion angles from tethered-walking flies. The median angle value is indicated for each angle as a reference point.
(B) Probability distribution functions of coxa rotation, femur rotation, and femur-tibia flexion angles from 39 flies (1,480 total seconds of walking). Only walking bouts are included. The distribution of femur-tibia flexion angles is broader for the front and rear legs, whereas the distribution of femur rotation angles is broader for the middle legs.
(C) UMAP embedding of coxa rotation, femur rotation, femur-tibia flexion angles across all legs, and their derivatives. Axis units are arbitrary. Although each fly has a characteristic gait, there is a continuum across most flies, with some flies offset from the rest.
(D) UMAP embedding as in (C), colored by the phase of the step cycle, revealing the match between the circular structure of the embedding and the step phase.
(E) UMAP embedding as in (C), colored by front-right leg femur-tibia flexion and femur rotation, and middle right leg femur-tibia flexion and femur rotation. Across multiple flies, the dynamics of the middle legs are dominated by femur rotation, whereas the dynamics of the front legs are dominated by femur-tibia flexion.
(F) Example 3D trajectories of a mouse reaching for a food pellet. The pellet is indicated as a black dot.
(G) Mean distance to pellet holder as a function of time across all 4 mice (88 hits, 69 bumps, 28 misses). Shaded areas are 95% confidence intervals. When reaches are aligned to the grasp attempt (0 ms), the hand is farther from the pellet holder on miss trials compared to hit or bump trials. Averaging across all mice reveals a clear difference between reach types.
(H) Representative trace of knee flexion from a walking human, tracked with Anipose. Data are from the Human 3.6M dataset. The median angle value is indicated at left as a reference point.
(I) Probability distribution function of knee flexion angle from 7 humans. Only sessions that include walking are included.
(J) UMAP embedding of knee flexion, hip rotation, and hip flexion angles across all legs, and their derivatives. Axis units are arbitrary. Although each human subject has a characteristic gait, most of the walking patterns map onto a common cylinder manifold.
(K) UMAP embedding as in (E) but colored by knee flexion for each leg. Coloring by knee flexion angle reveals the common phase alignment of the circles across subjects. See also Figures S6 and S7.
