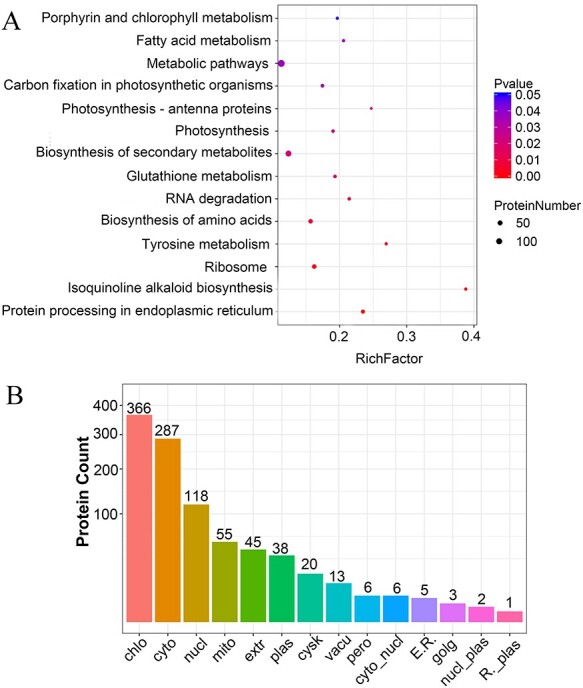
Figure 7.

Kyoto Encyclopedia of Genes and Genomes pathway enrichment analysis and subcellular localization prediction of DEPs. (A) The top 14 enriched pathways in which DEPs were placed, based on the tetraploids vs diploids comparison. The x-axis indicates the enrichment factor. The dot color and size indicate the P-value and protein number as shown on the right, (B) subcellular localization prediction of DEPs. The x-axis displays subcellular structure; the y-axis displays protein count.
