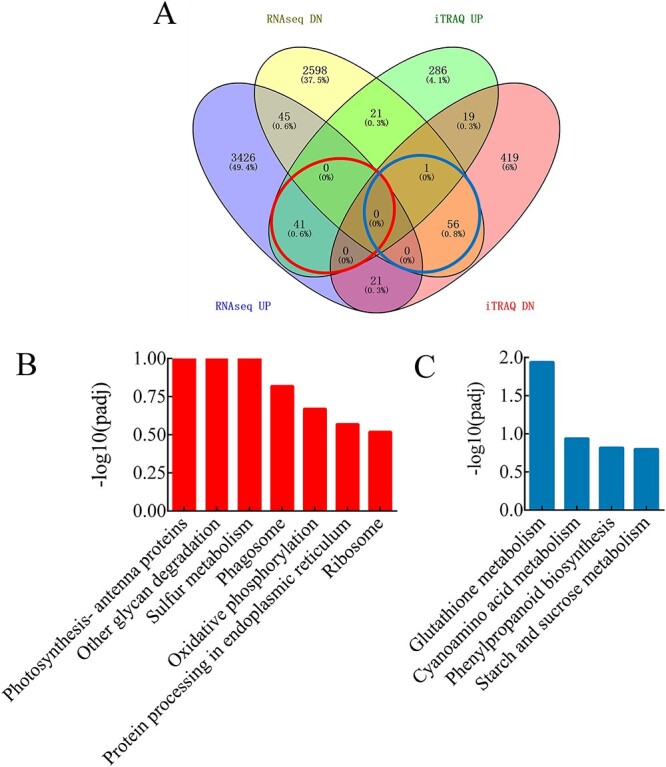
Figure 8.

Comparison of the relation between transcriptome and proteome. (A) Venn diagram showing the number and proportion of DEGs and DEPs within each of the four categories resulting from a relation analysis. The DEGs and DEPs were divided into four combinations: (i) increased transcript level induces protein expression up-regulation (rUP-pUP) (encircled in red), (ii) decreased transcript level induces protein expression up-regulation (rDN-pUP), (iii) increased transcript level induces protein expression down-regulation (rUP-pDN) and (iv) decreased transcript level induces protein expression down-regulation (rDN-pDN) (encircled in blue). We focused on DEGs with correlated expression changes (rUP-pUP (i) and rDN-pDN (iv)), being both transcript and protein level up or down, respectively. (B, C) Kyoto Encyclopedia of Genes and Genomes enrichment of up-regulated (B) and down-regulated (C) genes and proteins.
