
Figure 11.
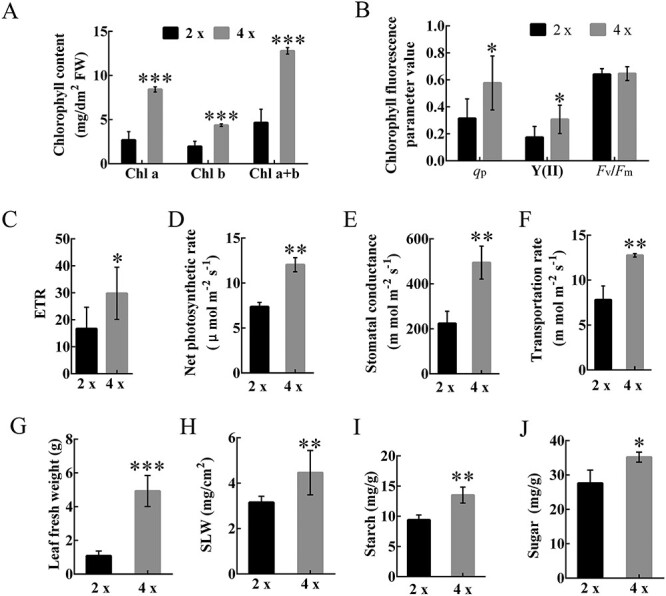
Enhanced photosynthetic capacity and biomass accumulation of tetraploids. (A–J) Bar graphs plotting (A) chlorophyll content (Chl a: chlorophyll a, Chl b: chlorophyll b and Chl a + b: total chlorophyll content), (B) chlorophyll fluorescence parameters (the photochemical quenching coefficient (qp), the photochemical quantum yield of PSII (Y(II)) and the maximal photochemical efficiency of PSII in the dark (Fv/Fm)), (C) ETR, (D) net photosynthetic rate, (E) stomatal conductance, (F) transportation rate, (G) leaf fresh weight, (H) mg/cm2, (I) starch content and (J) sugar content. Error bars indicate SE. Asterisks indicate significant differences between diploids and tetraploids (*P < 0.05; **P < 0.01; ***P < 0.001). 4×: tetraploid plants; 2×: diploid plants.