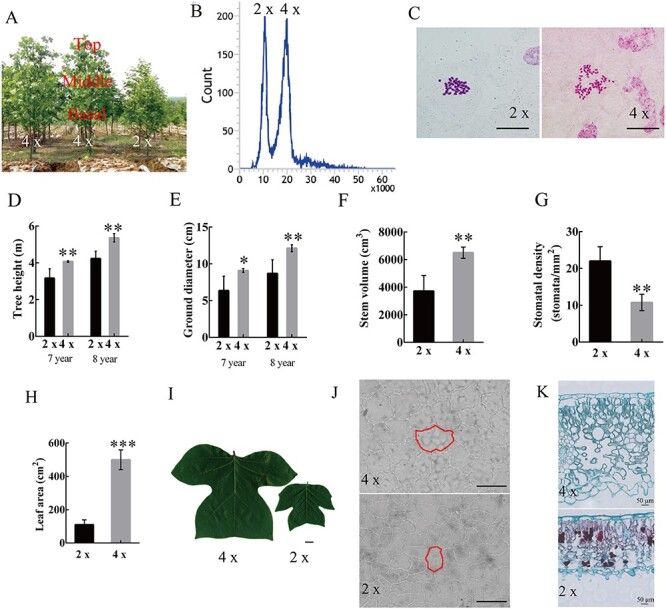
Figure 2.

Ploidy analysis and morphological comparison between tetraploids and diploids. (A) Plant morphology and sample position, (B) ploidy level of diploid and tetraploid plants, as determined by FCM (flow cytometry), (C) ploidy level of diploid and tetraploid plants, as determined by chromosome counting, bar =10 μm, (D) tree height (n = 5), (E) ground diameter (n = 5), (F) stem volume (n = 5), (G) stomatal density, (H) leaf area (n = 15), (I) leaf morphology, bar = 1 cm, (J) light microscope micrographs of adaxial epidermal cells in diploid and tetraploid leaves with the red circle representing a single epidermal cell, bar =100 μm, (K) light microscope micrographs depicting cross sections of diploid and tetraploid leaves. Error bars indicate SE. Asterisks indicate significant differences between diploid and tetraploid (**P < 0.01, ***P < 0.001). 4×: tetraploid plants; 2×: diploid plants.
