
Figure 4.
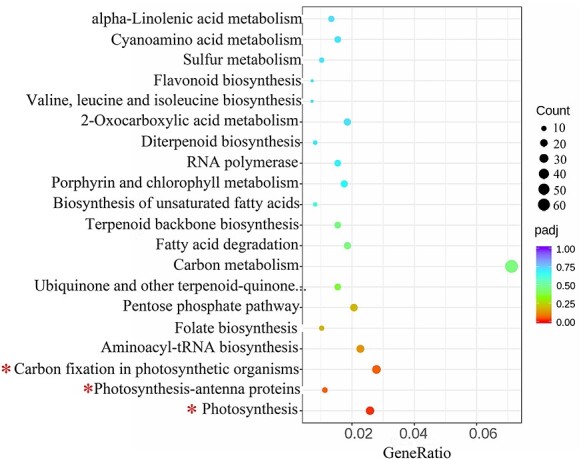
The KEGG pathway analysis of DEGs. The top 20 enriched KEGG pathways in which DEGs function, based on the tetraploids vs diploids comparison. The x-axis indicates the gene ratio. The dot color and size indicate the P-value and gene number as shown on the right. *biological functions associated with photosynthesis.