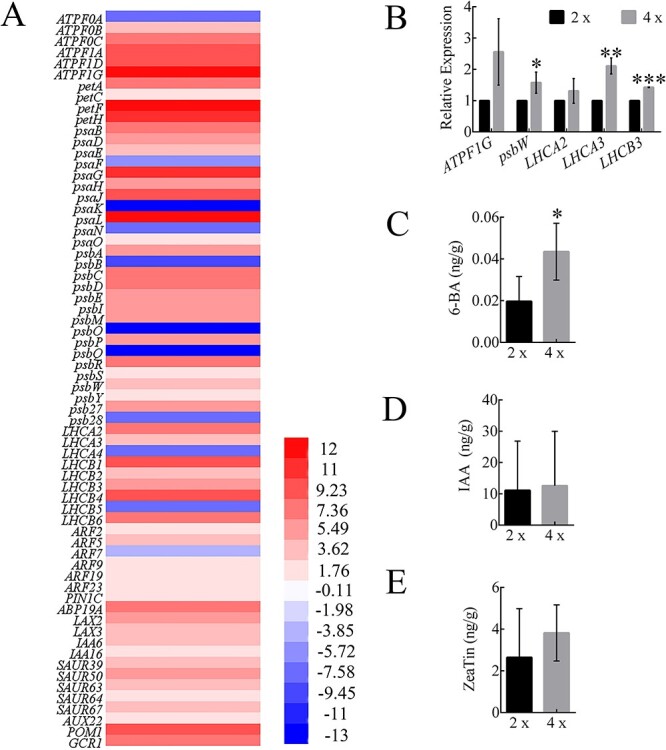
Figure 5.

Expression level of DEGs and plant hormones. (A) A heatmap showing changes in expression levels of DEGs related to photosynthesis and plant hormone signal transduction of tetraploids vs diploids. The gradient color barcode at the right indicates log2 (fold change) values with up-regulated genes represented by positive values and down-regulated genes represented by negative values. (B) Quantitation of expression of several key photosynthesis genes in the leaves of tetraploids vs diploids, RT-qPCR data were means ± SE (n = 3). (C–E) Determination of 6-BA (C), IAA (D) and ZeaTin (E). 4×: tetraploid plants; 2×: diploid plants.
