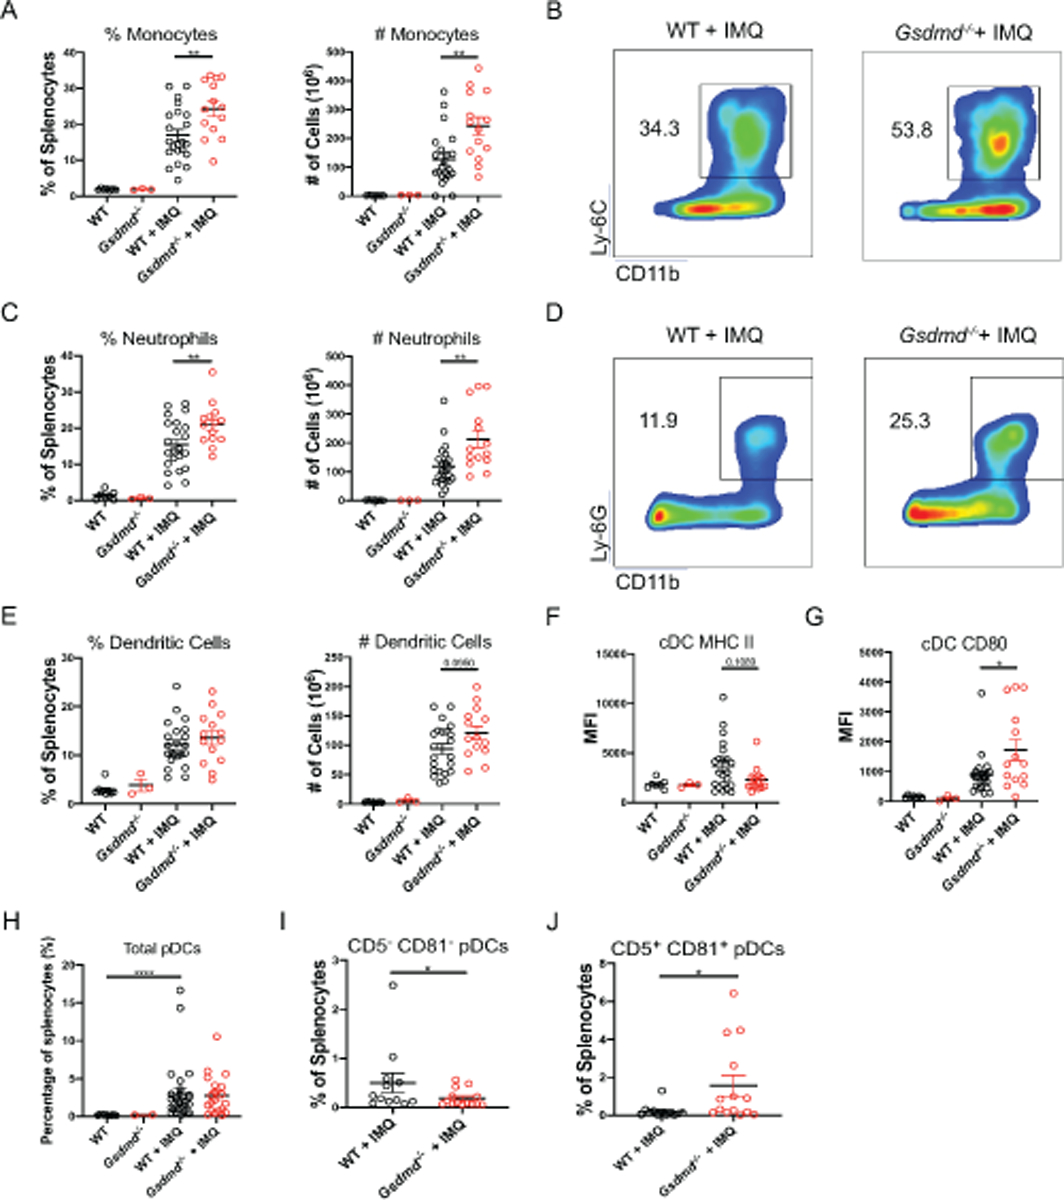
Figure 2. Gsdmd−/− mice display myeloid cell expansion and activation.

Splenocytes from untreated and imiquimod-treated WT and Gsdmd−/− mice were analyzed by flow cytometry to quantify (A, B) proinflammatory monocytes, (C, D) neutrophils, (E) conventional dendritic cells (cDC), cDC MHC II, and CD80 expression, (H–J) ‘classical’ and ‘nonclassical’ plasmacytoid DCs. (A–G) n=7 WT, 3 Gsdmd−/−, 24 WT + IMQ, 12 Gsdmd−/− + IMQ), (H–J) n=12 WT + IMQ, 14 Gsdmd−/− + IMQ. Dots indicate individual mice. Results represent mean ± SEM. Statistics were calculated by non-parametric Mann-Whitney test; *p < 0.05, **p < 0.01.
