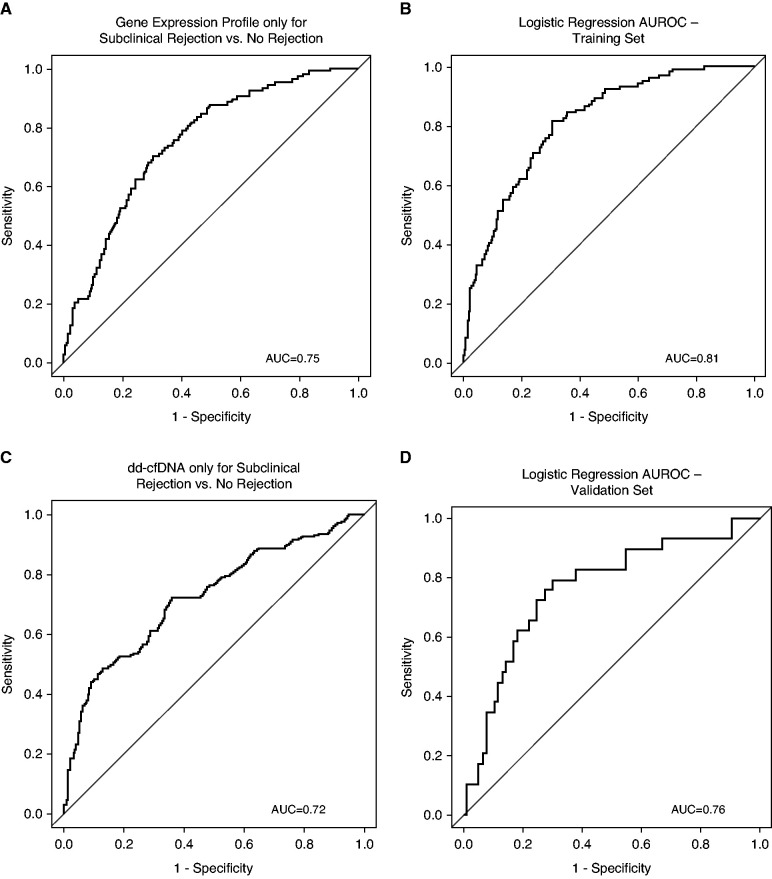
Figure 4.
Performance metrics of individual gene expression profile and donor-derived cfDNA assays compared with the logistic regression model with continuous variables for combined gene expression profile and donor-derived cfDNA to distinguish subclinical rejection versus no rejection. (A) AUROC of the gene expression profile only for subclinical rejection versus no rejection. (B) AUROC of the combined gene expression profile and donor-derived cfDNA performance on the CTOT-08 cohort (training set) by the multivariable logistic regression model using the continuous score output of both tests. (C) AUROC of donor-derived cfDNA only for subclinical rejection versus no rejection. (D) AUROC of an external validation with an independent cohort (n=105 samples) by the multivariable logistic regression model using the continuous score output of both tests. AUC, area under the curve.

