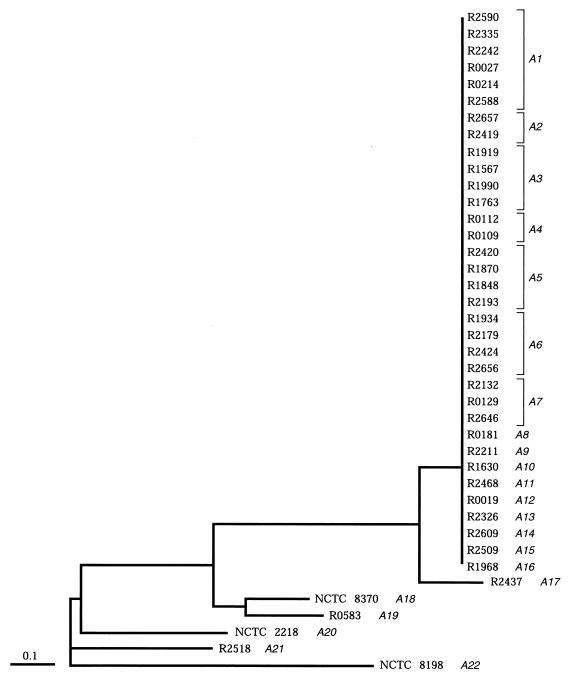
FIG. 2.
Dendrogram showing the relationships between serotype M1 isolates, inferred from overall restriction site similarities (on PFGE) estimated with the equation of Nei and Li (16). These were used to construct an unrooted tree with the FITCH option of the PHYLIP package. The corresponding FAFLP profiles are shown in italics, next to the strain numbers. All isolates except strain NCTC 2218 exhibited emm1 RFLP type 1.H1.

