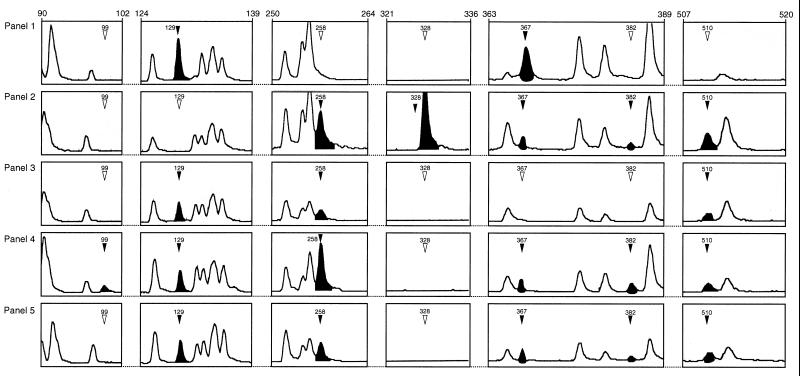
FIG. 3.
GeneScan 2.1 software-derived electropherograms showing examples of areas of polymorphism within FAFLP profiles for EcoRI+0 plus MseI+T amplifications of five GAS genomes. Panels 1 to 5 correspond to FAFLP profiles A1, A15, A6, A14, and A5, respectively. The solid arrowheads and peaks indicate a fragment characteristic of that profile (sizes are indicated in base pairs). Open arrowheads indicate the absence of a polymorphic fragment from that profile.

