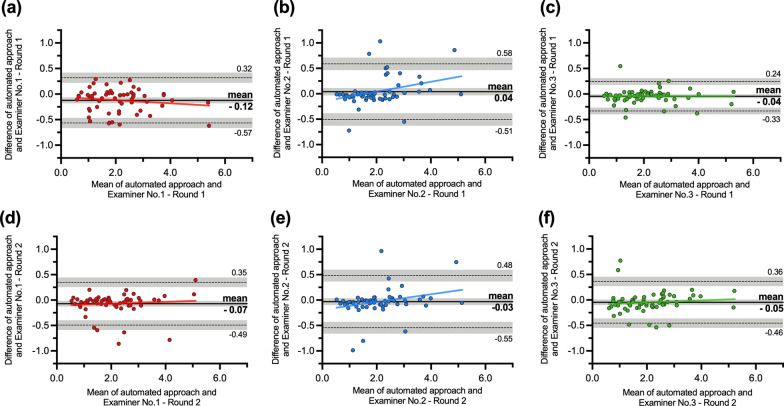
Fig. 2.
Bland–Altman plots showing a comparison of digital measurements of gingival recession between Examiner No. 1 (red dots), No. 2 (blue dots), and No. 3 (green dots) in the first (a–c) and second round of measurements (d–f) in reference to automated curvature-based approach. The x-axis indicates the mean measurement of the gingival recession between compared approaches. The y-axis indicates the difference between compared approaches. A black line with the surrounding grey area indicates mean bias and 95% confidence interval. A dashed black line with a surrounding grey area indicates either upper or lower 95% limits of agreement and corresponding 95% confidence interval

