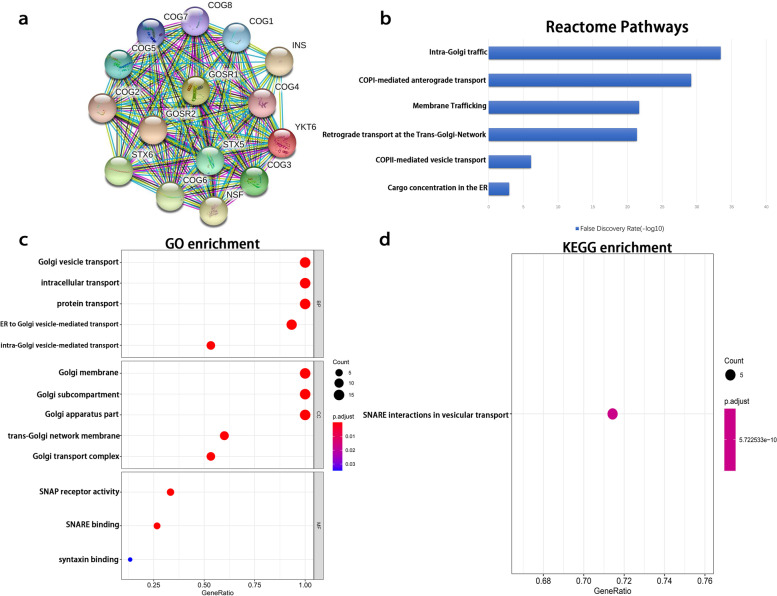
Fig. 2.
Results of KEGG, GO, and Reactome enrichment. a Protein-protein interaction (PPI) network. b GO analysis. c KEGG analysis. d Reactome enriched pathways. b-c The X-axis represents the ratio of involved genes, and the Y-axis represents the GO and KEGG terms. Each bubble represents a term. The size of the bubble indicates the number of involved genes. More red color indicates the smaller p values. The longer bar indicates the more reliable pathways. d The X-axis represents the false discovery rate and the Y-axis represents the pathway terms. The longer the bar the more reliable the pathways

