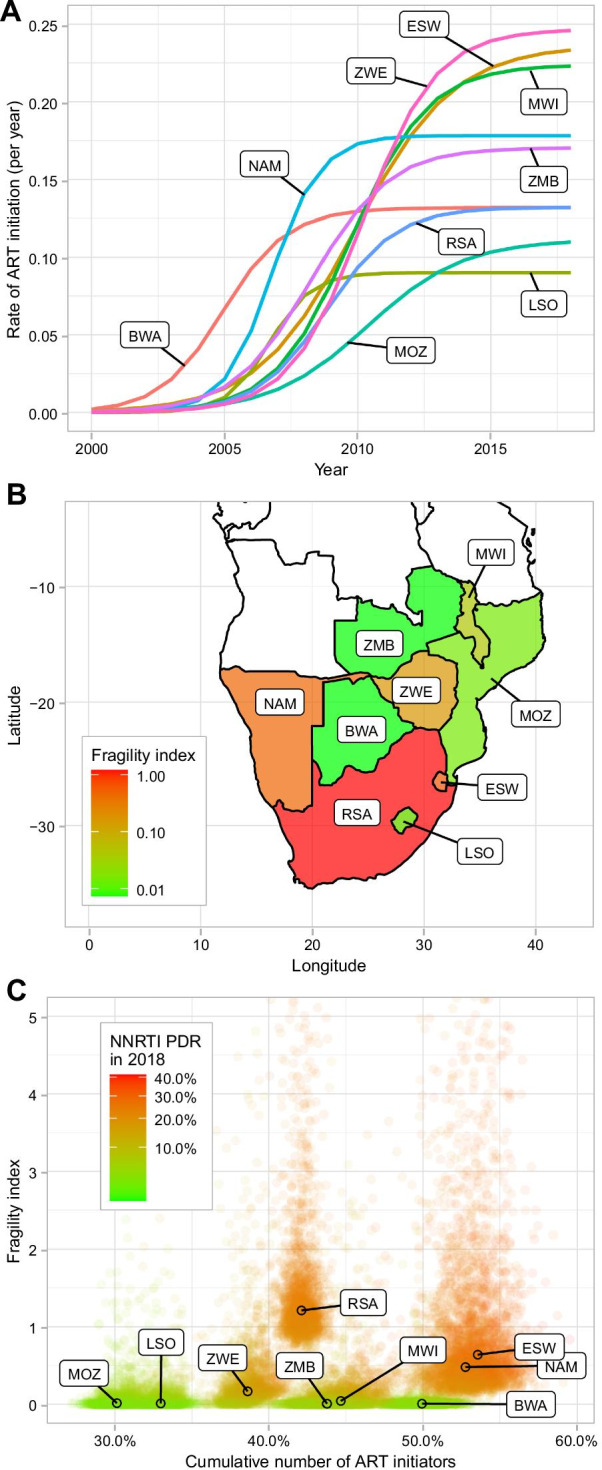
Fig. 3.

A Visualising ART rollout: change in the rate of ART initiation (per year) between 2000 and 2018 as estimated from the model. B Estimates of the fragility index of ART programmes by country. C Three-way scatter plot between the posterior samples of: the fragility index of ART programmes (y-axis), the proportion of all persons living with HIV that initiated ART over the period 2000–2018 (x-axis) and the predicted levels of pretreatment NNRTI resistance (PDR) in 2018 (colour gradient). BWA Botswana, ESW Eswatini, LSO Lesotho, MWI Malawi, MOZ Mozambique, NAM Namibia, RSA Republic of South Africa, ZMB Zambia, ZWE Zimbabwe
