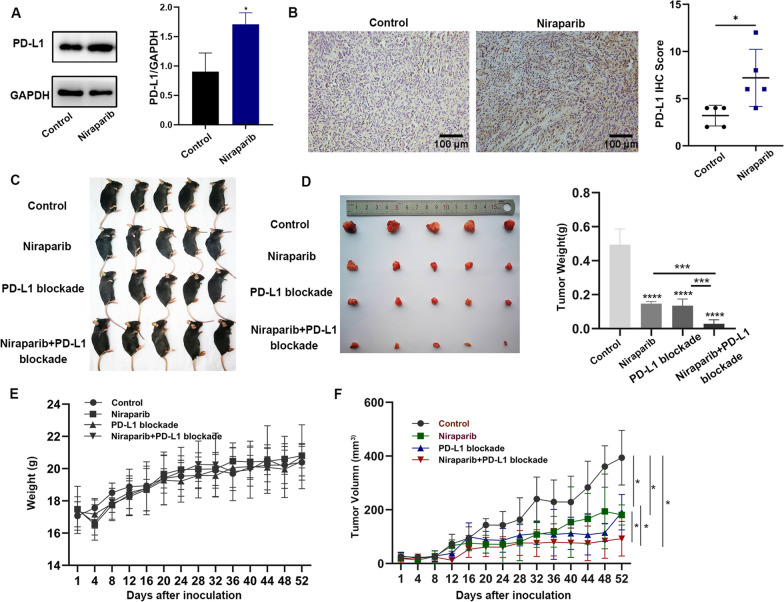
Fig. 2.
Niraparib upregulates PD-L1 expression of ovarian cancer cells in vivo and has a synergistic effect with PD-L1 blockade. A Western blot (WB) analysis of the PD-L1 expression in mouse tumor tissues from the control and Niraparib treatment (25 mg/kg, four times a week) group. B Representative images of immunohistochemistry (IHC) staining of PD-L1 in mouse ovarian cancer samples. Scale bar:100 μm. C, D Tumor volumes of four treatment groups with control (PBS, 100 μl), Niraparib (25 mg/kg), PD-L1 blockade (10 mg/kg, twice of the week), and Niraparib with PD-L1 blockade. E Weight curve of immunocompetent C57BL/6 mice treated with control, Niraparib, PD-L1 blockade, and the combination for 52 days. F Tumor growth curve of immunocompetent C57BL/6 models treated with control, Niraparib, PD-L1 blockade, and the combination for 52 days. Data are presented as the mean ± SD. *P < 0.05, **P < 0.01, ***P < 0.001

