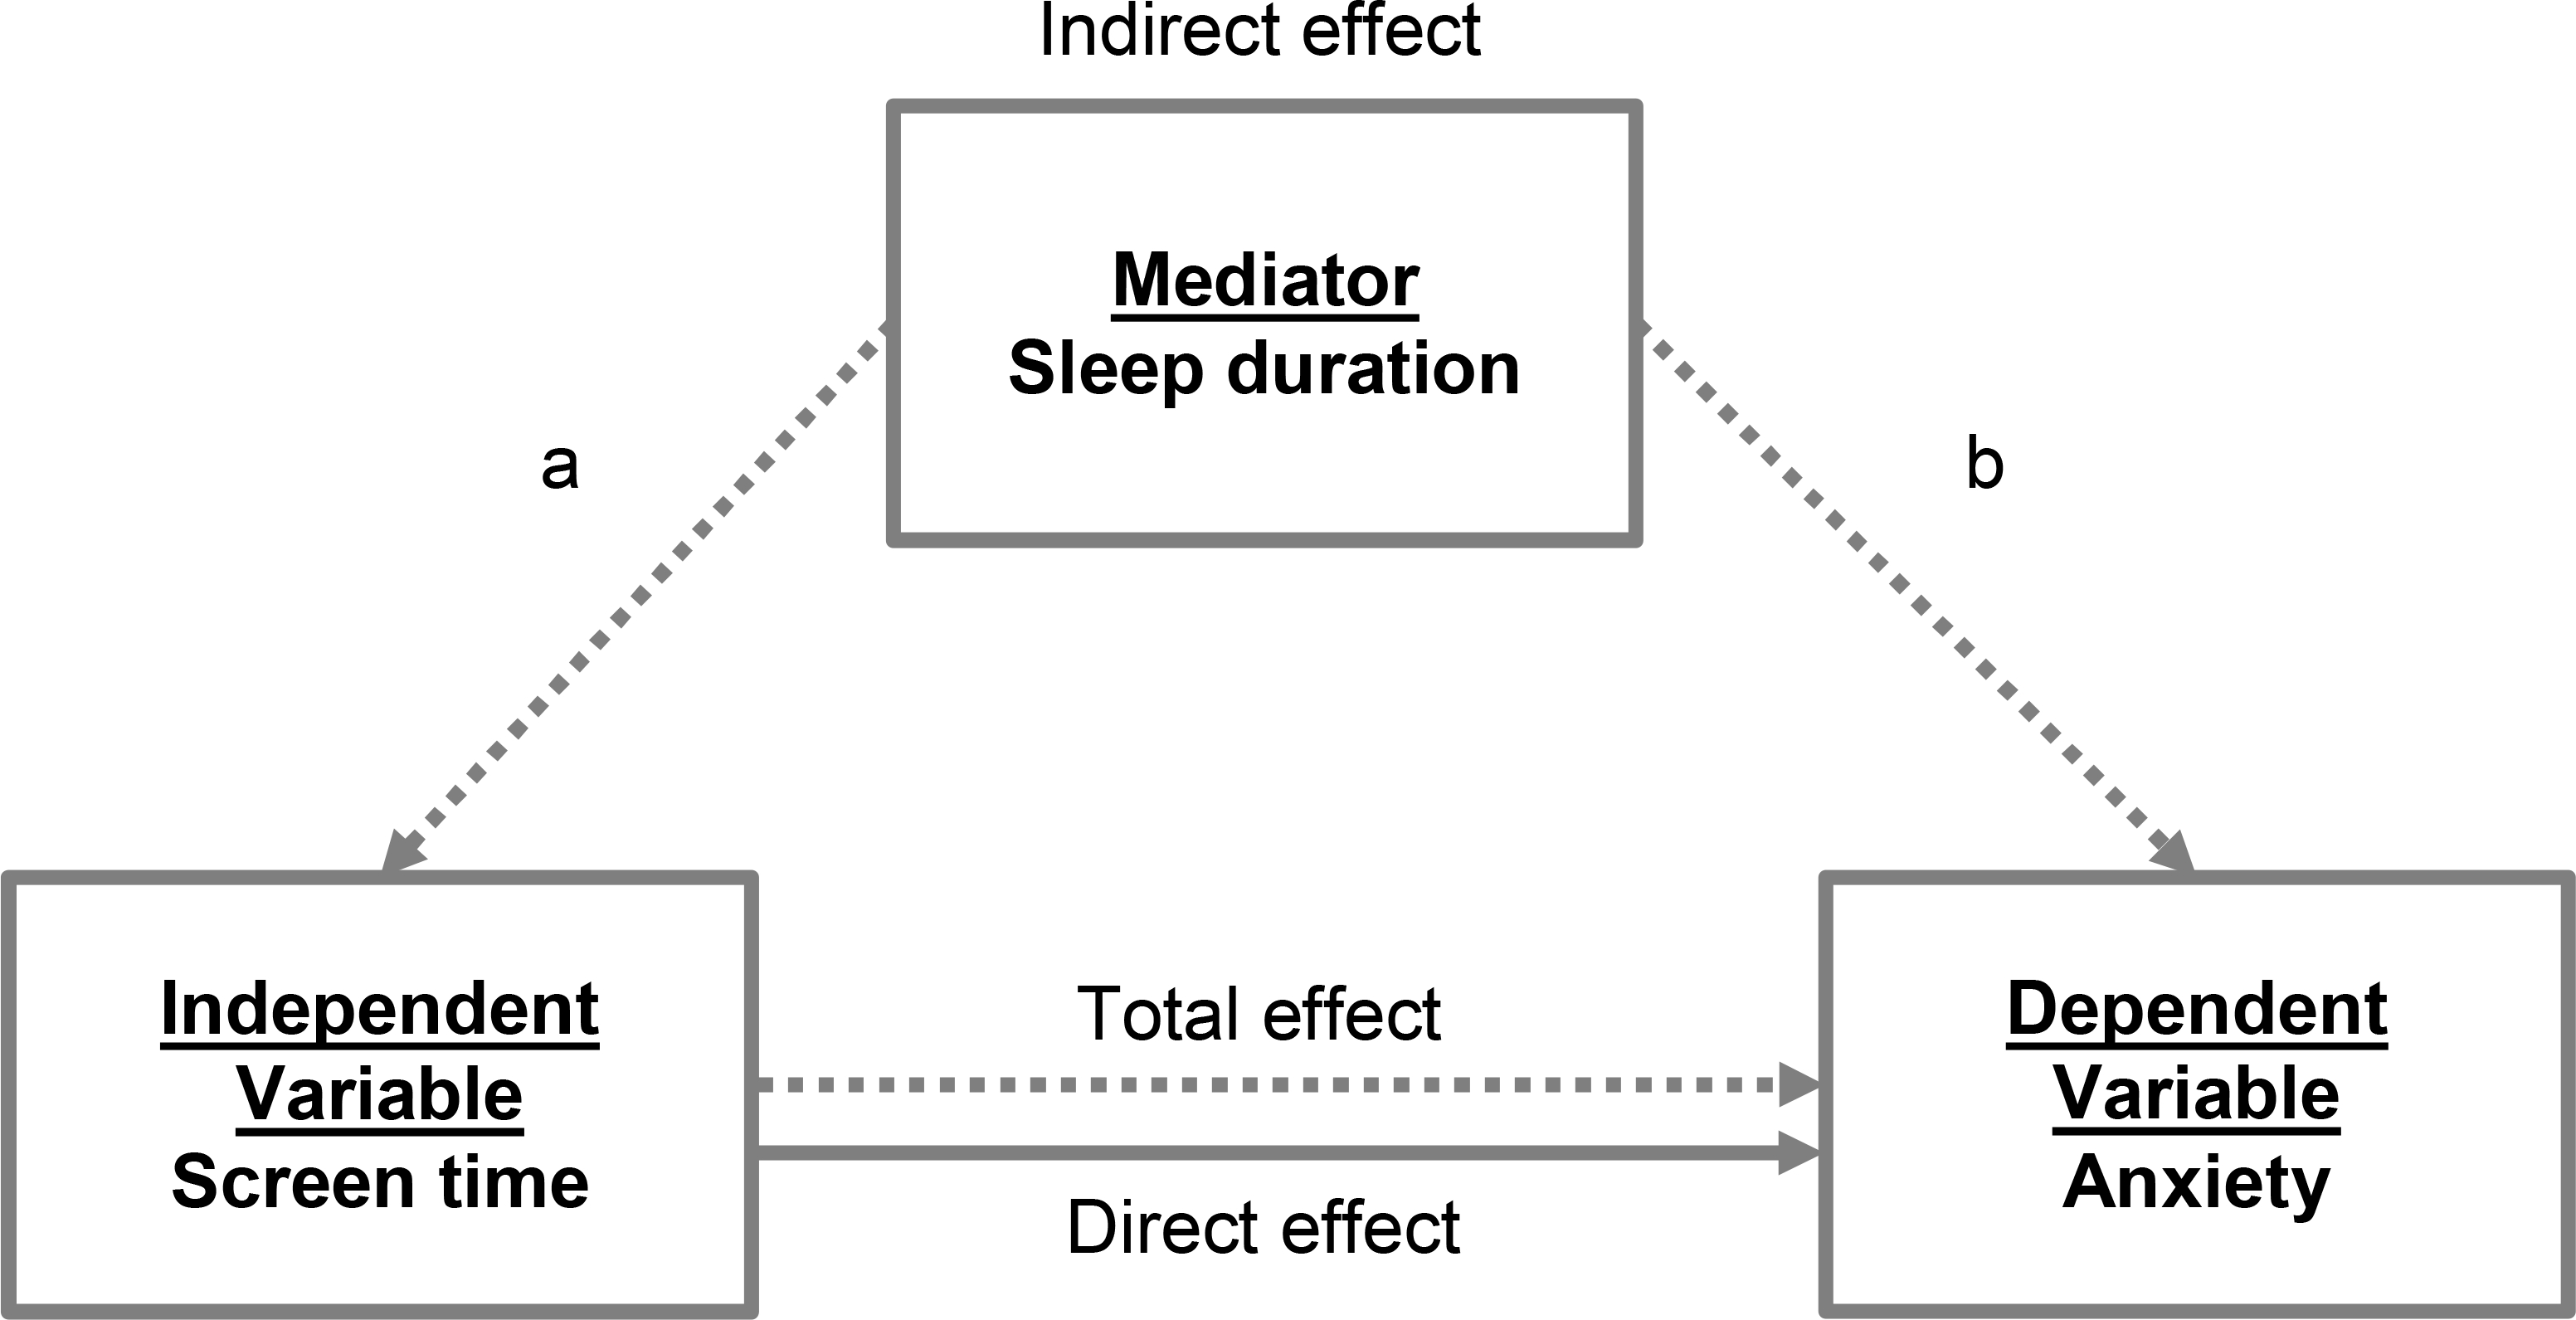
Figure 2. Mediation analysis.

The figure depicts the hypothesized relationship between screen time, sleep, and anxiety. a represents the “a” path and b represents the “b” path. Analysis adjusted for confounders (not shown) including sex, age, poverty level, insurance type, parent education, language spoken at home, race/ethnicity, household generation, family structure, comorbid conditions, and emotional/behavioral medications.
