
Figure 1 .
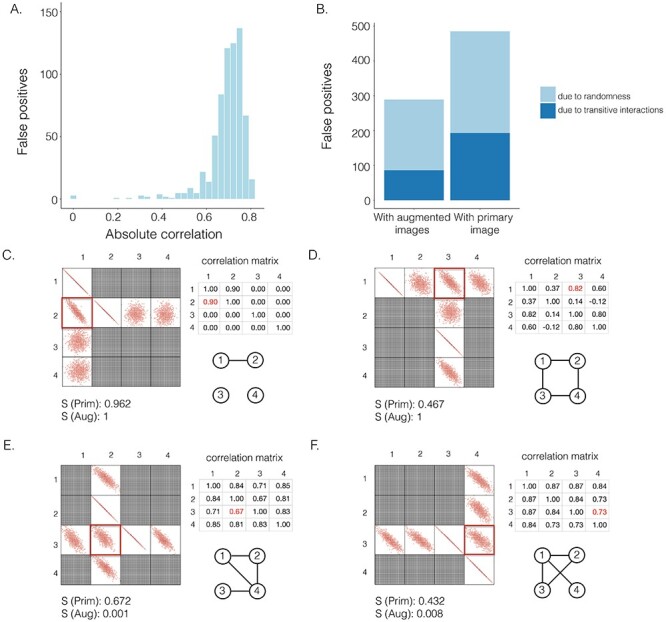
The effectiveness of neighbor images in reconstructing GRNs on the simulated data. A. The distribution of false positives from CNNC. B. The false positives of the two models with primary ( ) and augmented (
 ) images as inputs due to randomness and transitive interactions. C and D. Two examples that demonstrate both of the models can correctly identify the direct interactions (C:
  , D:
, D:  ). E and F. Two examples that demonstrate the model trained by augmented images can recognize and eliminate the false positives caused by the transitive edges (E:
  , F:
, F:  ).
).  denotes the confidence scores from CNNC with primary (
 ) or augmented images (
 ) as inputs. The values in the correlation matrices are Pearson correlation coefficients for the gene pairs in the corresponding entries. The primary images are highlighted in the red squares.