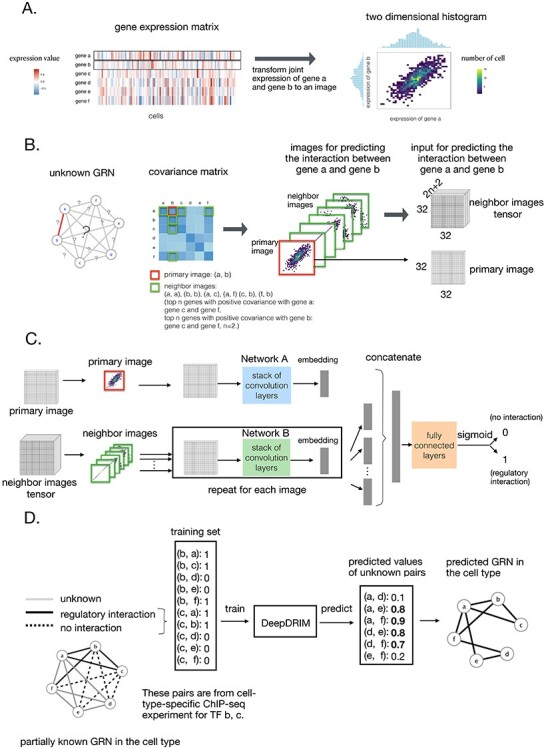
Figure 2 .

Overview of DeepDRIM. A. Representation of the joint gene expression of gene a and gene b as a primary image. B. The  neighbor images are generated from the genes with strong positive covariance with gene a or gene b. C. The network architecture of DeepDRIM, including Network A and Network B, which are two stacked convolutional embedding structures designed to process the primary and neighbor images, respectively. Detailed network structures are shown in Supplementary Figure S3. D. An example for the prediction of a cell-type-specific GRN using DeepDRIM.
