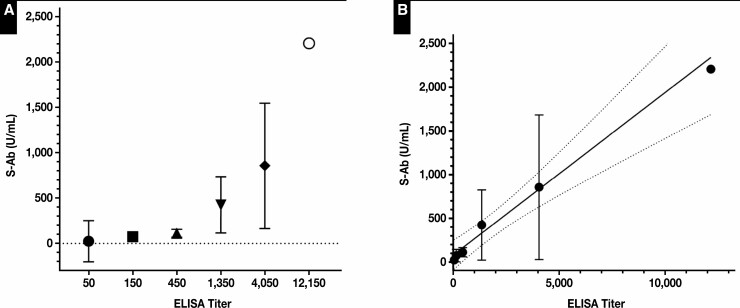
Figure 5.
Spike protein antibody (S-Ab) concentration vs an anti-spike ELISA titer. A, Comparison between S-Ab concentrations and anti-spike ELISA titers shown for 38 samples grouped by increasing ELISA titers. The mean S-Ab concentration and the corresponding 95% confidence interval for each ELISA titer group are shown. The sample size of each ELISA titer group are as follows: N(50) = 2, N(150) = 10, N(450) = 8, N(1,350) = 9, N(4,050) = 8, N(12,150) = 1. B, A linear regression of S-Ab concentrations vs ELISA titers plotted on a linear scale shows moderate correlation (r2 = 0.52) despite significant variability seen in S-Ab concentrations. y = 0.19x + 80 (depicted as a solid line and the 95% confidence bands of the best fit line are represented by the dotted lines).

