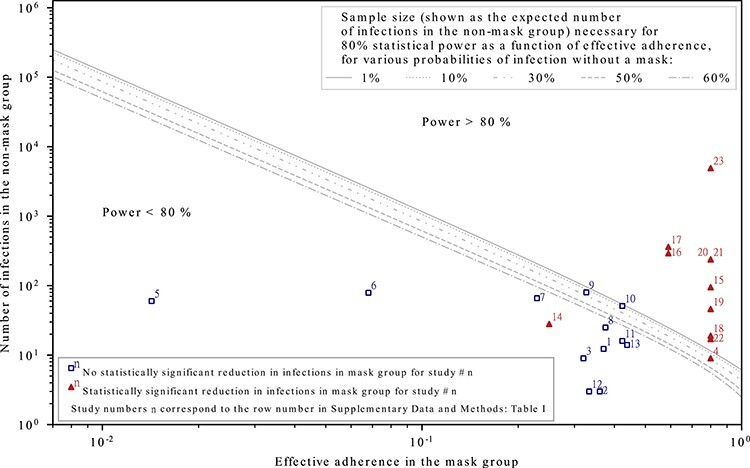
Figure 1.

The effective adherence and sample sizes of studies that found masks to be effective (triangles) and those that did not (squares). Empirical studies with higher levels of statistical power consistently show that masks protect the wearer; studies with lower statistical power are mixed, as would be expected. The statistical power depends on the sample size, the effective adherence (i.e. mask effectiveness multiplied by the fraction of exposures for which masks are on average worn in the mask group) and probability of being infected without a mask in the setting of the study. Each curve depicts the required sample size (expressed as the expected number of infections in the non-mask group) as a function of effective adherence in order for the study to have a power of 80%. The scattered data points depict the size and effective adherence of studies taken from a recent systematic review18; the numbers on the data points correspond to row numbers of the studies in Supplementary Data and Methods: Supplementary Table S1. (Note that they do NOT correspond to the numbers in References.) The effective adherence for the studies are overestimated by assuming that masks are 100% effective; even with this assumption, the studies numbered 1 through 14 were found to have <80% statistical power. See Supplementary Data and Methods for data and mathematical details.
