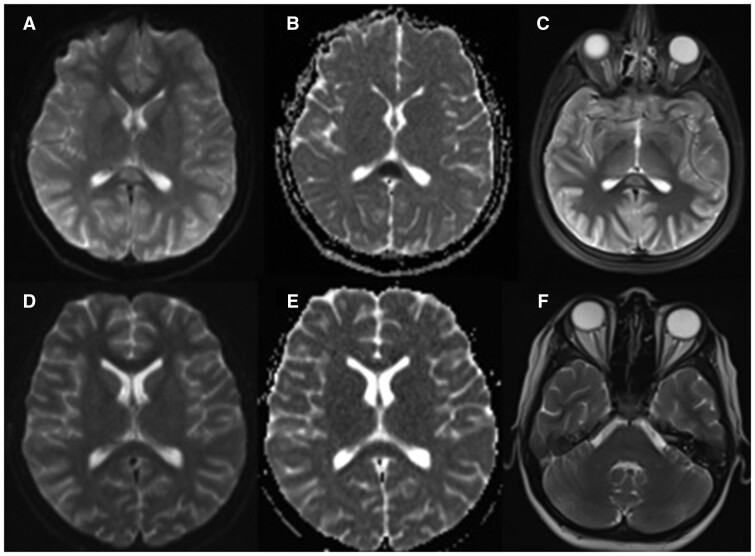
Fig. 1.
Brain magnetic resonance imaging of the patient. T2-weighted axial (A), apparent diffusion coefficient (B) images of the patient on day 1 show hyperintensity and restricted diffusion in the splenium of the corpus callosum and T2-weighted axial (C) image shows normal optic nerve head. T2-weighted axial (D), apparent diffusion coefficient (E) images on day 7 show hyperintensity and restricted diffusion in the corpus callosum regressed and T2-weighted axial (F) image on day 10 shows optic nerve head protrusion and globe flattening.

