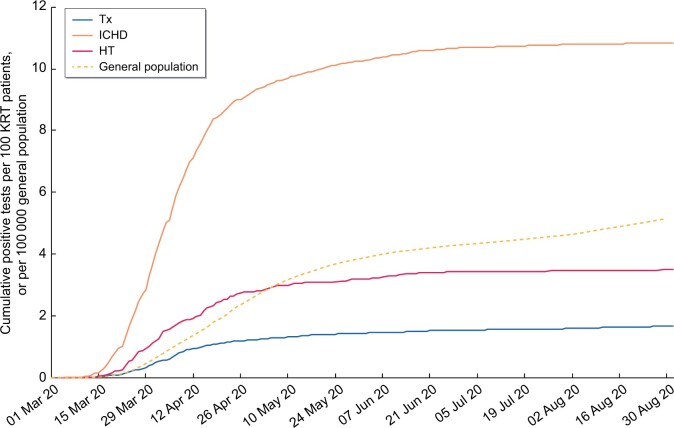
FIGURE 1:
Kaplan–Meier ‘failure’ plot of cumulative incidence of SARS-CoV-2 infections in patients on KRT and the general population in England from 1 March to 31 August 2020. Presented as cases per 100 people on each modality included in the study cohort for the KRT population and per 100 000 England population.

