
FIGURE 5:
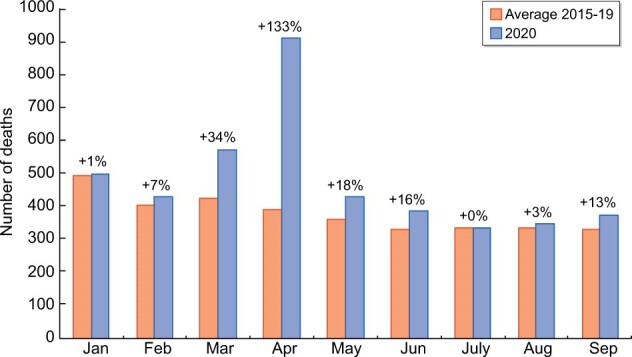
Excess deaths by month during the period January–September 2020 compared with the average between January and September 2015–2019 for the prevalent population on KRT in England at the beginning of each year.
Official websites use .gov
A
.gov website belongs to an official
government organization in the United States.
Secure .gov websites use HTTPS
A lock (
) or https:// means you've safely
connected to the .gov website. Share sensitive
information only on official, secure websites.
Excess deaths by month during the period January–September 2020 compared with the average between January and September 2015–2019 for the prevalent population on KRT in England at the beginning of each year.