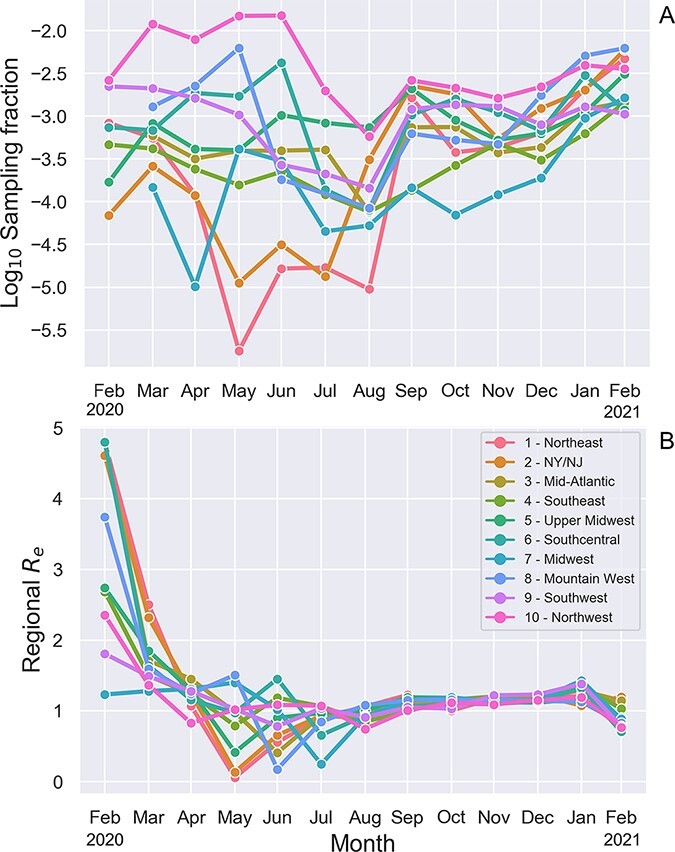
Figure 1.

Background spatiotemporal heterogeneity in sampling fractions and effective reproductive number Re of SARS-CoV-2 in the US. (A) Sampling fractions estimated based on the number of full viral genomes deposited to GISAID relative to the estimated number of total COVID infections in each region and time interval. (B) Effective reproductive number Re estimates from the ML SARS-CoV-2 phylogeny. A regional transmission effect was estimated for each region and time interval, which was then used to rescale the estimated base transmission rate to compute Re. The base transmission rate was estimated to be 0.184 per day, which assuming a constant recovery/removal rate of 0.14 per day yields an estimated time-averaged  . States are grouped into the geographic regions designated by the US Department of Health and Human Services.
