Figure 5.

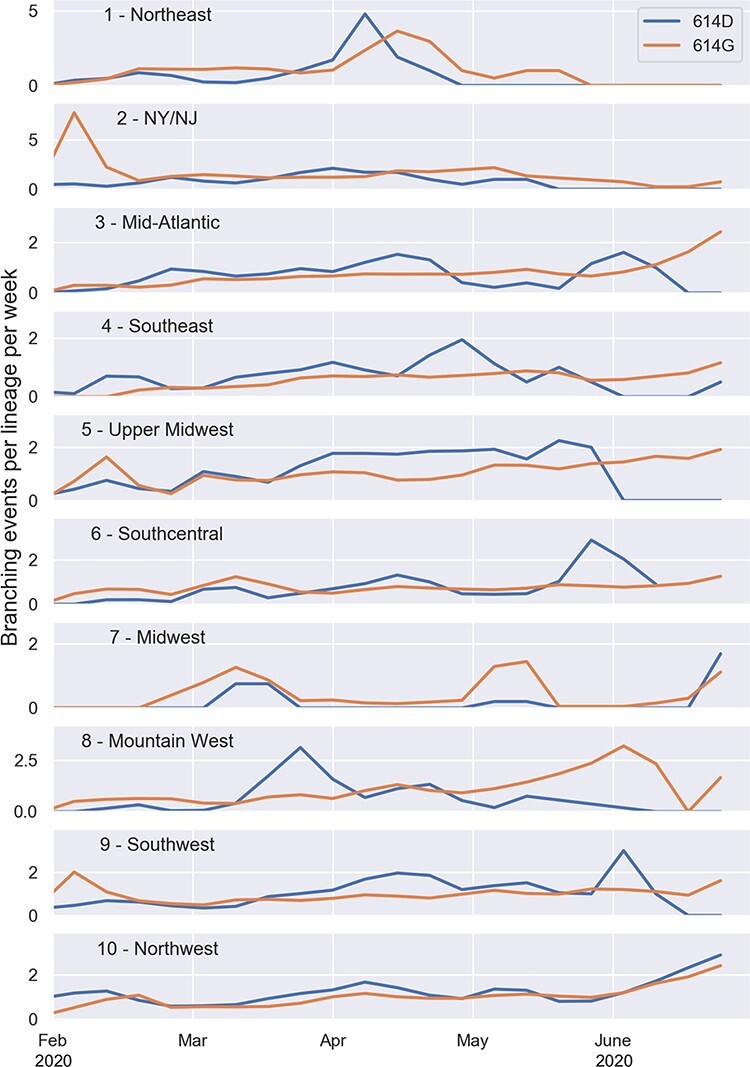
Branching rates per lineage in each region for lineages with the Spike 614D versus 614G variant. Branching rates are reported here as the number of branching events per week in the ML phylogeny for lineages with either variant.

Branching rates per lineage in each region for lineages with the Spike 614D versus 614G variant. Branching rates are reported here as the number of branching events per week in the ML phylogeny for lineages with either variant.