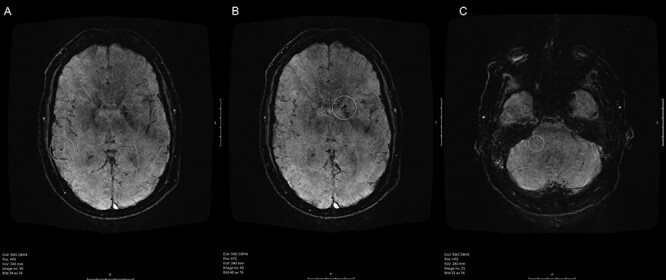
Fig. 1.

Susceptibility weighted imaging (SWI) MRI of the patient’s brain. (A) Highlights (white ring) a CMB in the right temporal lobe, (B) shows a CMB in the basal ganglia in the left hemisphere, whereas (C) shows an infratentorial CMB.

Susceptibility weighted imaging (SWI) MRI of the patient’s brain. (A) Highlights (white ring) a CMB in the right temporal lobe, (B) shows a CMB in the basal ganglia in the left hemisphere, whereas (C) shows an infratentorial CMB.