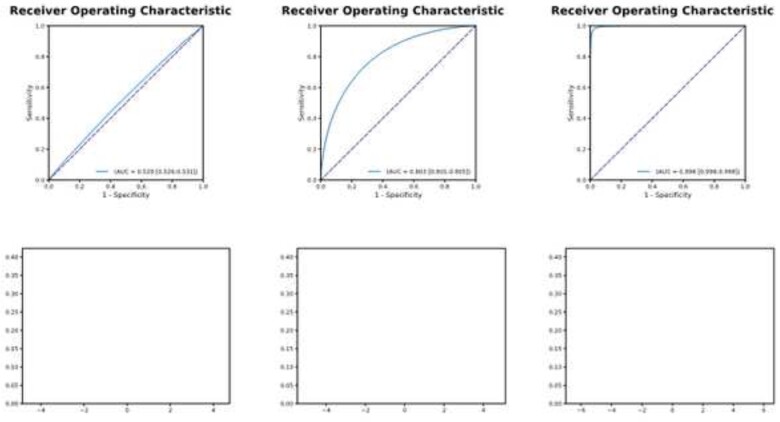
Figure 3.
The receiver operating characteristic curve and model performance. Left panel: A test with an area under the curve of 0.529 (top) results in very poor separation of the classes (bottom left). As the area under the curve increases (0.803 middle panel, top and 0.998 right panel, top) the separation of the classes and utility of the test improves (bottom panels). This results in improved sensitivity and specificity. See text for additional details.

