
Figure 3.
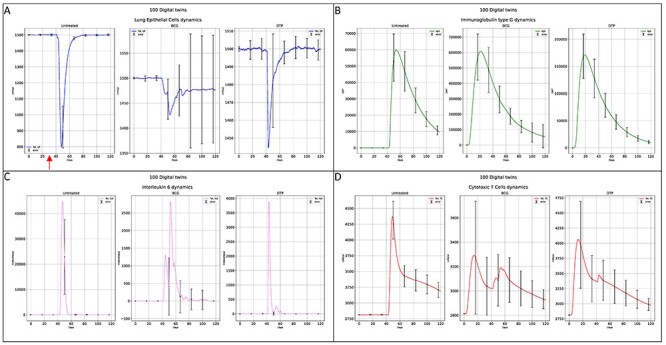
Immune response elicited by BCG and DTP vaccine interventions compared to the untreated case. Panel A shows the cytopathic effects on lung epithelial cells to evaluate the severity of the SARS-CoV-2 infection. Panel B depicts the humoral response measured through the immunoglobulins class G (geometric mean titers, GMT). Panel C reports IL-6 as a predictor of the severity of inflammation and the potentiality to develop a cytokines storm that can eventually lead to severe damage and fatal prognosis. Panel D highlights cellular response through the dynamics of specific CD8+ T cells.