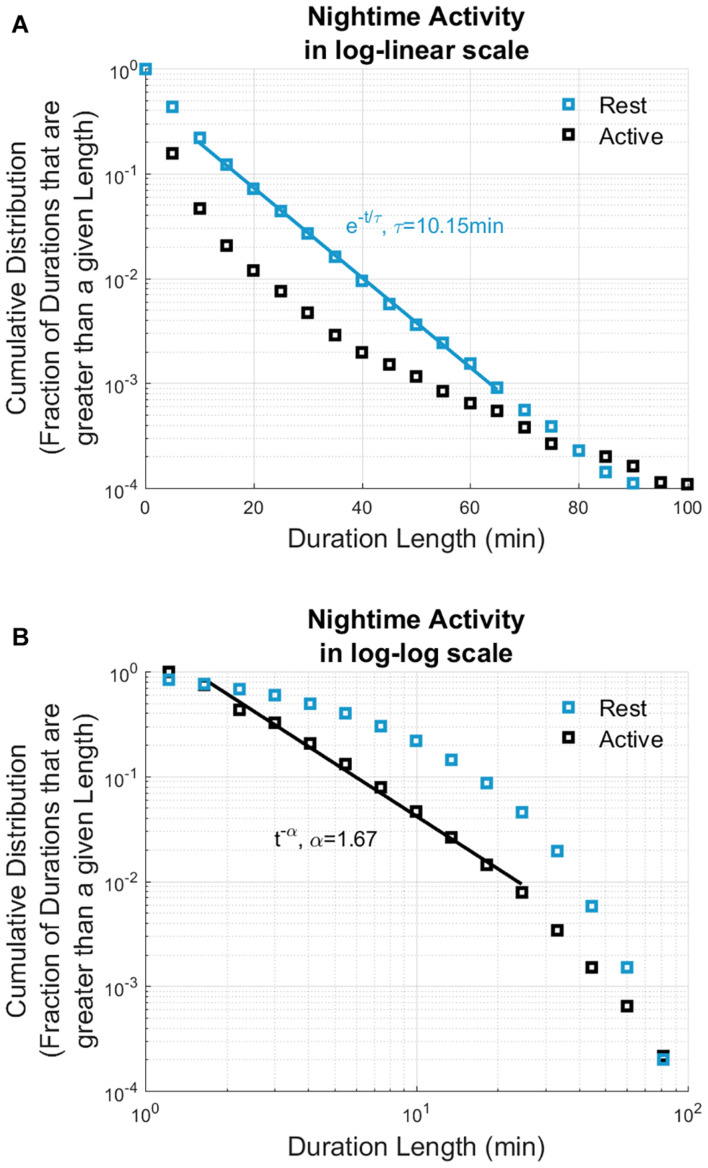
FIGURE 2.
Cumulative distribution of rest and active durations based on 14,736 h of nighttime actigraphy data recorded from all participated patients (n = 22). The cumulative distributions of nighttime rest periods (displayed in blue) show exponential distribution, whereas active periods (displayed in black) show power law distribution. Solid lines show the best straight-line fits: rest durations can be fitted by a straight line in log-linear scale (A), and active durations can be fitted with a straight line in log-log scale (B). X axis display the nighttime durations; Y axis show the cumulative distributions. The current actigraphy data analysis revealed similar nighttime rest/activity dynamics to nighttime sleep/wake dynamics based on polysomnography data analysis (Lo et al., 2013).

