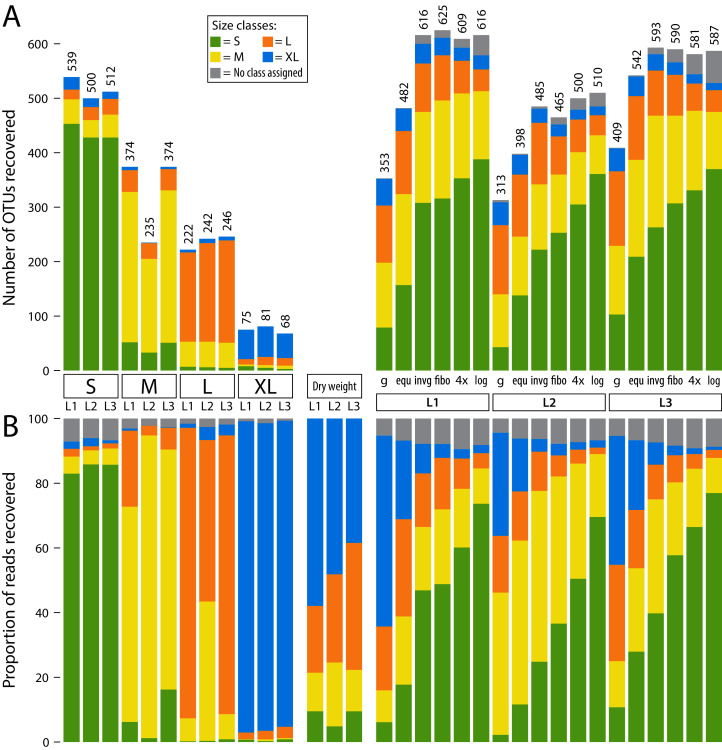
Figure 2. Detected OTUs across different samples (L1, L2 and L3).
OTUs are assigned to size classes using the individually sequenced size fractions (S, M, L, XL). Some low-abundance OTUs were not recovered in individual size fractions, but in pooled samples. Thus, a size class was not assigned (grey bars). The four individual fractions were also pooled in silico at 1/4 sequencing depth (each filtered with a 0.04% threshold) to simulate equally pooling the samples. (A) barplots showing the number of OTUs recovered from individual size fractions as well as pooled samples (L1–L3). (B) barplots showing relative read abundance across samples (L1, L2 and L3). The “Dry weight” bars show the expected distribution of size classes based on relative abundance of dry weight of each size fraction, allowing a comparison to the proportionally pooled samples (g) that simulate a complete unsorted Malaise trap sample.

