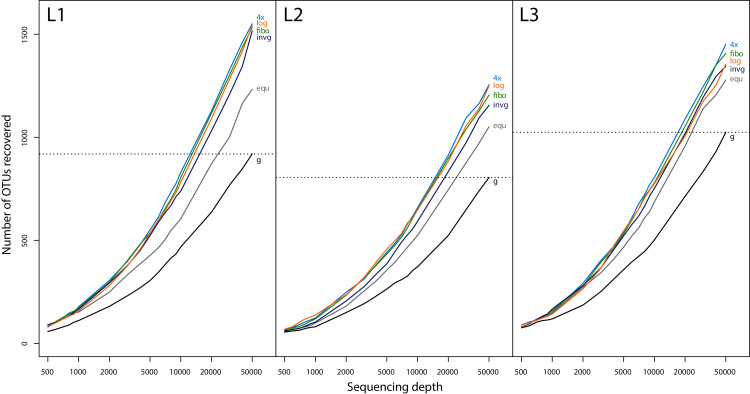
Figure 3. Rarefaction curves at different sequencing depths for all three samples (L1, L2 and L3) and lysates pooled in different proportions.
The taxon recovery of the unsorted Malaise sample (g) at 50,000 reads sequencing depth is used to estimate the increase in sequencing depth needed to recover a similar number of OTUs to what is recovered from samples that are size sorted and pooled in favour of smaller size fractions. The OTU counts in this rarefaction analysis are slightly higher than in our other analyses since replicates were pooled directly, without removing reads that are not in both replicates and without discarding OTUs or reads below 0.01% abundance.

