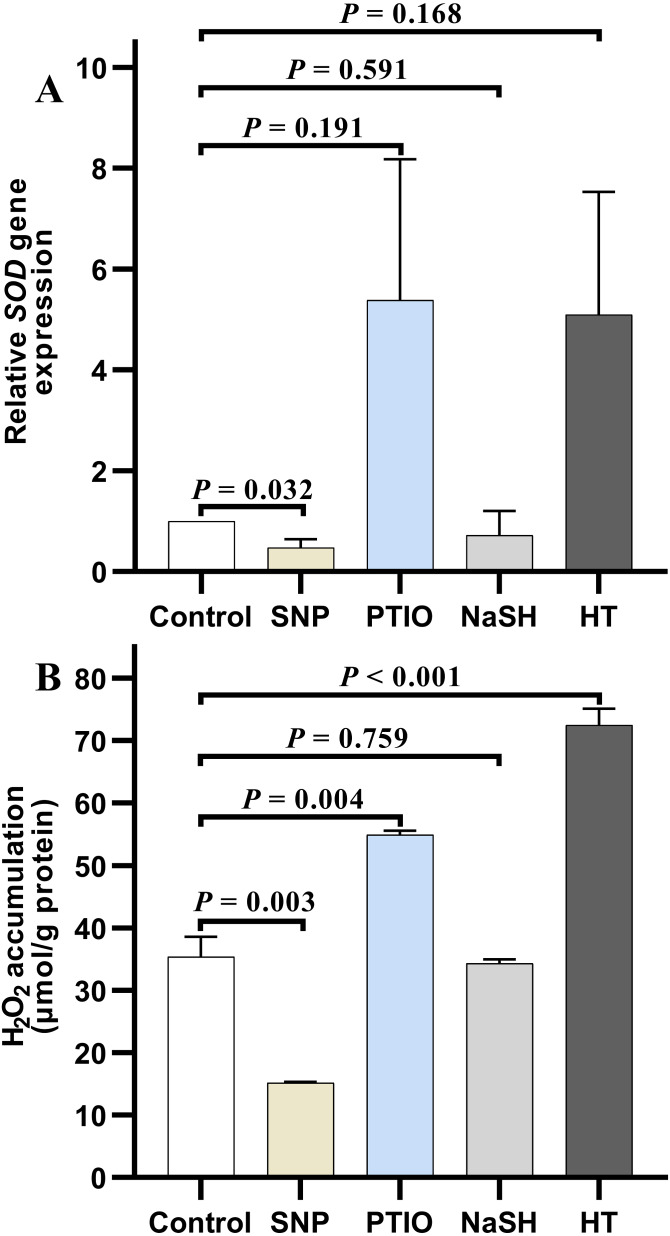
Figure 4. H2O2 accumulation and SOD relative expression level in Vibrio alginolyticus after treated with H2S and NO and their donors or scavengers under NOR-induced stress.
(A) relative expression level of SOD. (B) H2O2 accumulation. The differences between the control and treatment were determined by unpaired t test of the statistical t-Test (df = 4), and F test was used to compare the variances. “P” stands for P value (two-tailed).

