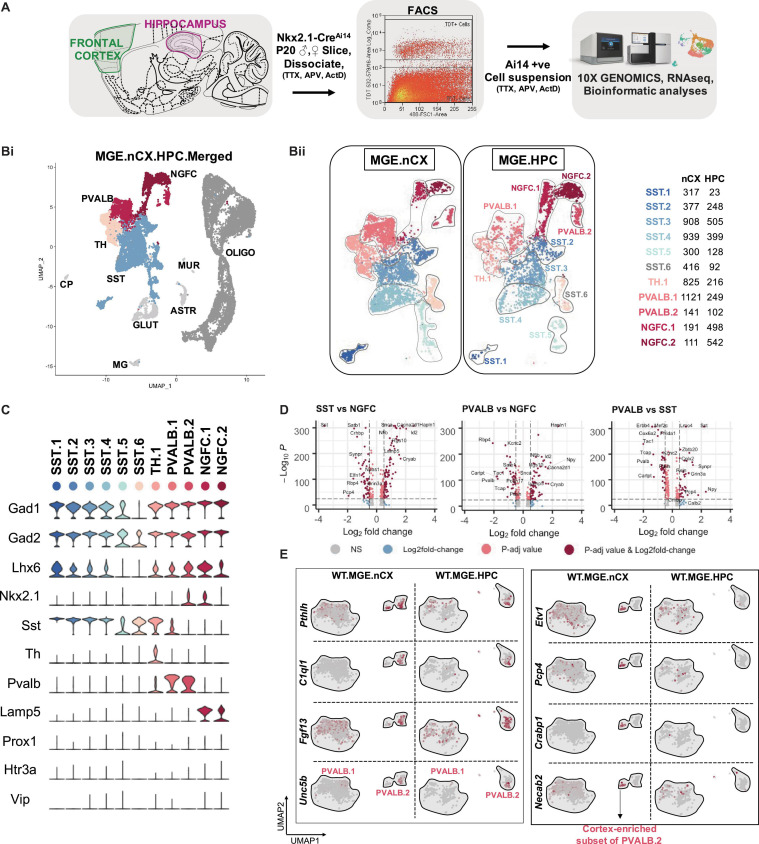
FIGURE 1.
Identification of MGE-derived interneuron subtypes in the cortex and hippocampus. (A) Overview of the experimental workflow. (Bi) Uniform Manifold Approximation and Projection (UMAP) dimensional reduction of 19,028 single-cell transcriptomes (9,064 from frontal cortex and 9,964 from hippocampus of 6 mouse brains, 3 biological replicates), showing the cardinal MGE populations. Cell clusters were color coded and annotated post hoc based on their transcriptional profile identities (Cell type abbreviations: PVALB, Parvalbumin; NGFC, Neurogliaform; TH, Tyrosine Hydroxylase; SST, Somatostatin; GLUT, Glutamatergic; CP, Choroid Plexus; MG, Microglia; ASTR, Astrocyte; MUR, Mural; OLIGO, Oligodendrocyte). (Bii) UMAP visualization of 11 MGE-derived interneuron subtypes from neocortex (MGE.nCX) and hippocampus (MGE.HPC), and the recovery of cell numbers from the subtypes. (Biii) Table indicating the number of Gad1/Gad2 + cells recovered in each MGE subtype from the neocortex and hippocampus, and the defining genes enriched in each subtype. (C) Violin plot showing the distribution of expression levels of well-known representative cell-type-enriched marker genes across the11 MGE subtypes. (D) –log10 False Discovery Rate (FDR) vs. log2 fold change (FC) between each of the MGE cardinal class, representing the top enriched markers at a fold change ≥ 0.5 and FDR < 10e-25. (E) UMAP representation of PVALB clusters highlighting the cortex-specific enrichment of Pthlh-expressing PVALB.2 subtype that is not observed in the hippocampus.

