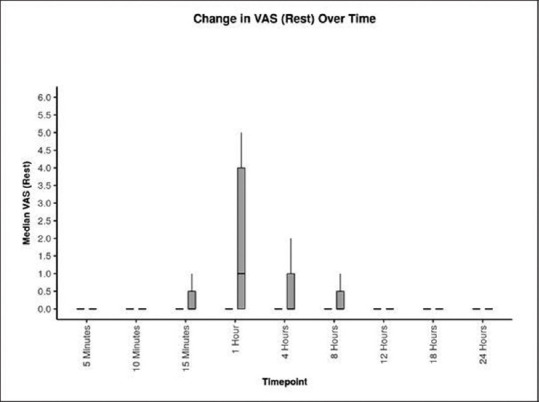
Figure 2.

Postoperative comparison of visual analogue scale (VAS) at rest in Group ‘Block’(black colour) versus Group ‘No block’(grey colour) in patients undergoing modified radical mastoidectomy. Values are represented as box and whisker plot. The horizontal line is median, main box as inter-quartile range and the longitudinal lines are range
