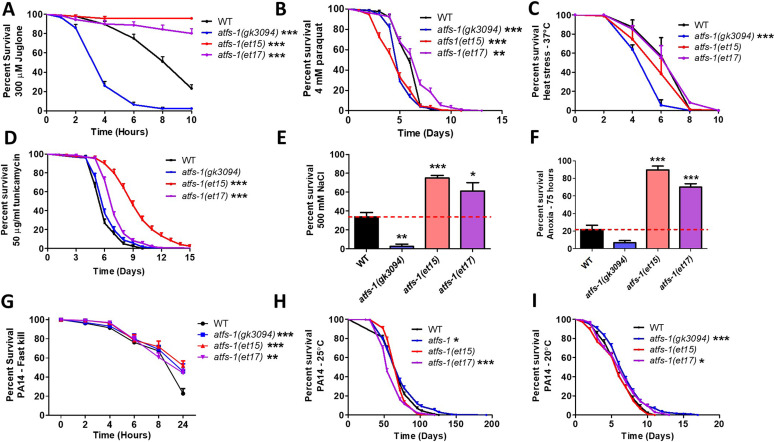
Figure 4. Constitutive activation of ATFS-1 increases resistance to multiple external stressors.
To determine the role of ATFS-1 in resistance to stress, the stress resistance of an atfs-1 loss-of-function mutants (atfs-1(gk3094)) and two constitutively active atfs-1 gain-of-function mutants (atfs-1(et15), atfs-1(et17)) was compared with wild-type worms. (A) Activation of ATFS-1 enhanced resistance to acute oxidative stress (300 μM juglone), whereas disruption of atfs-1 markedly decreased resistance to acute oxidative stress. (B) Disruption of atfs-1 decreased resistance to chronic oxidative stress (4 mM paraquat). atfs-1(et17) mutants showed increased resistance to chronic oxidative stress, whereas atfs-1(et15) mutants had decreased resistance. (C) Resistance to heat stress (37°C) was not enhanced by activation of ATFS-1, whereas disruption of atfs-1 decreased heat stress resistance. (D) Constitutive activation of ATFS-1 increased resistance to ER stress (50 μM tunicamycin), whereas disruption of atfs-1 had no effect. (E) Activation of ATFS-1 increased resistance to osmotic stress (500 mM NaCl), whereas disruption of atfs-1 decreased osmotic stress resistance. (F) Constitutively active atfs-1 mutants show increased resistance to anoxia (75 h), whereas atfs-1 deletion mutants exhibit a trend towards decreased anoxia resistance. (G) Activation of ATFS-1 increased resistance to Pseudomonas aeruginosa toxin in a fast kill assay. A slow kill assay in which worms die from internal accumulation of P. aeruginosa was performed according to two established protocols. (H) At 25°C, atfs-1(et17) mutants showed a small decrease in resistance to bacterial pathogens (PA14), wheras atfs-1(gk3094) mutants showed a small increase in resistance. (I) At 20°C, both atfs-1(et17) and atfs-1(gk3094) mutants exhibited a small increase in resistance to bacterial pathogens. Data for WT and atfs-1(gk3094) in panel (I) are from Campos et al (2021) as these strains were used as controls for two separate experiments that were performed at the same time. Data information: Error bars indicate SEM. *P < 0.05, **P < 0.01, ***P < 0.001. Statistical analysis for panels (A, B, D, H, I) were performed using the log-rank test. Statistical analysis for panels C and G were performed using a two-way ANOVA with Bonferroni post hoc test. Statistical analysis for panels (E, F) was performed using a one-way ANOVA with Bonferroni post hoc test. The number of replicates, N, and statistical analysis can be found in Table S6.

