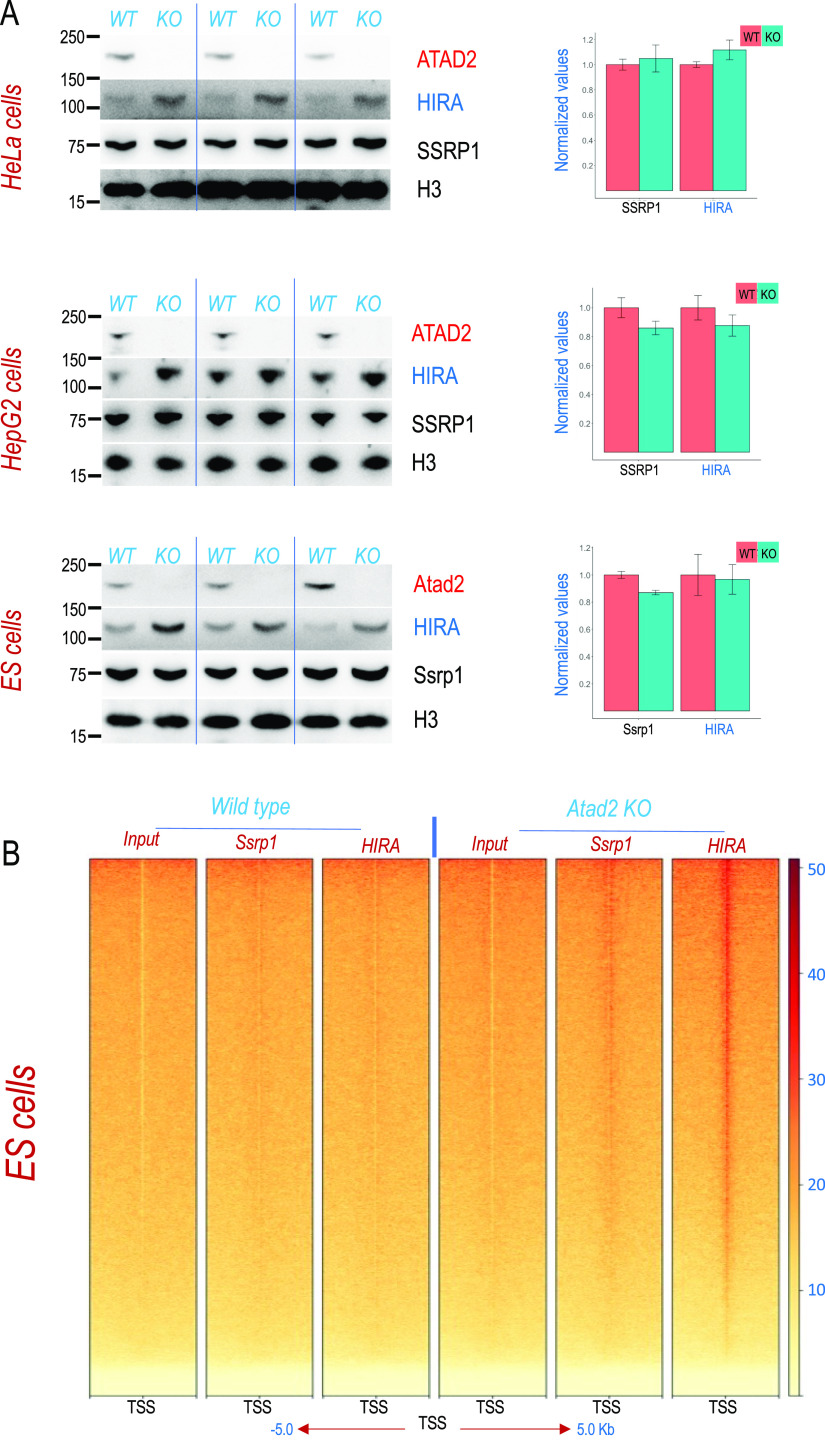
Figure 3. Atad2 controls FACT and HIRA interaction with chromatin.
(A) Extracts from human HeLa and HepG2 and mouse embryonic stem cells after ATAD2 KO (by CRISPR/Cas9 system) were probed with the indicated antibodies. Three independent different biological replicates are shown (left panels). SSRP1- and HIRA-encoding mRNAs were also quantified from parallel cultures of the same cell lines (three independent biological replicates) by RT-qPCR. The mean values were calculated from triplicates for each biological replicate (n = 3) and are shown in the bar diagrams for wild-type (red) and ATAD2 KO (green) cells (right panels). Error bars indicate the standard errors of the mean values. (B) Mononucleosomes generated after extensive digestion of chromatin from wild-type and Atad2 KO embryonic stem cells were immunoprecipitated with the indicated antibodies and the immunoprecipitated DNA fragments were sequenced. A heat map of read density over −5 to +5 kb centred on all transcription start sites is shown (the density scale is shown on the right).
Source data are available for this figure.

