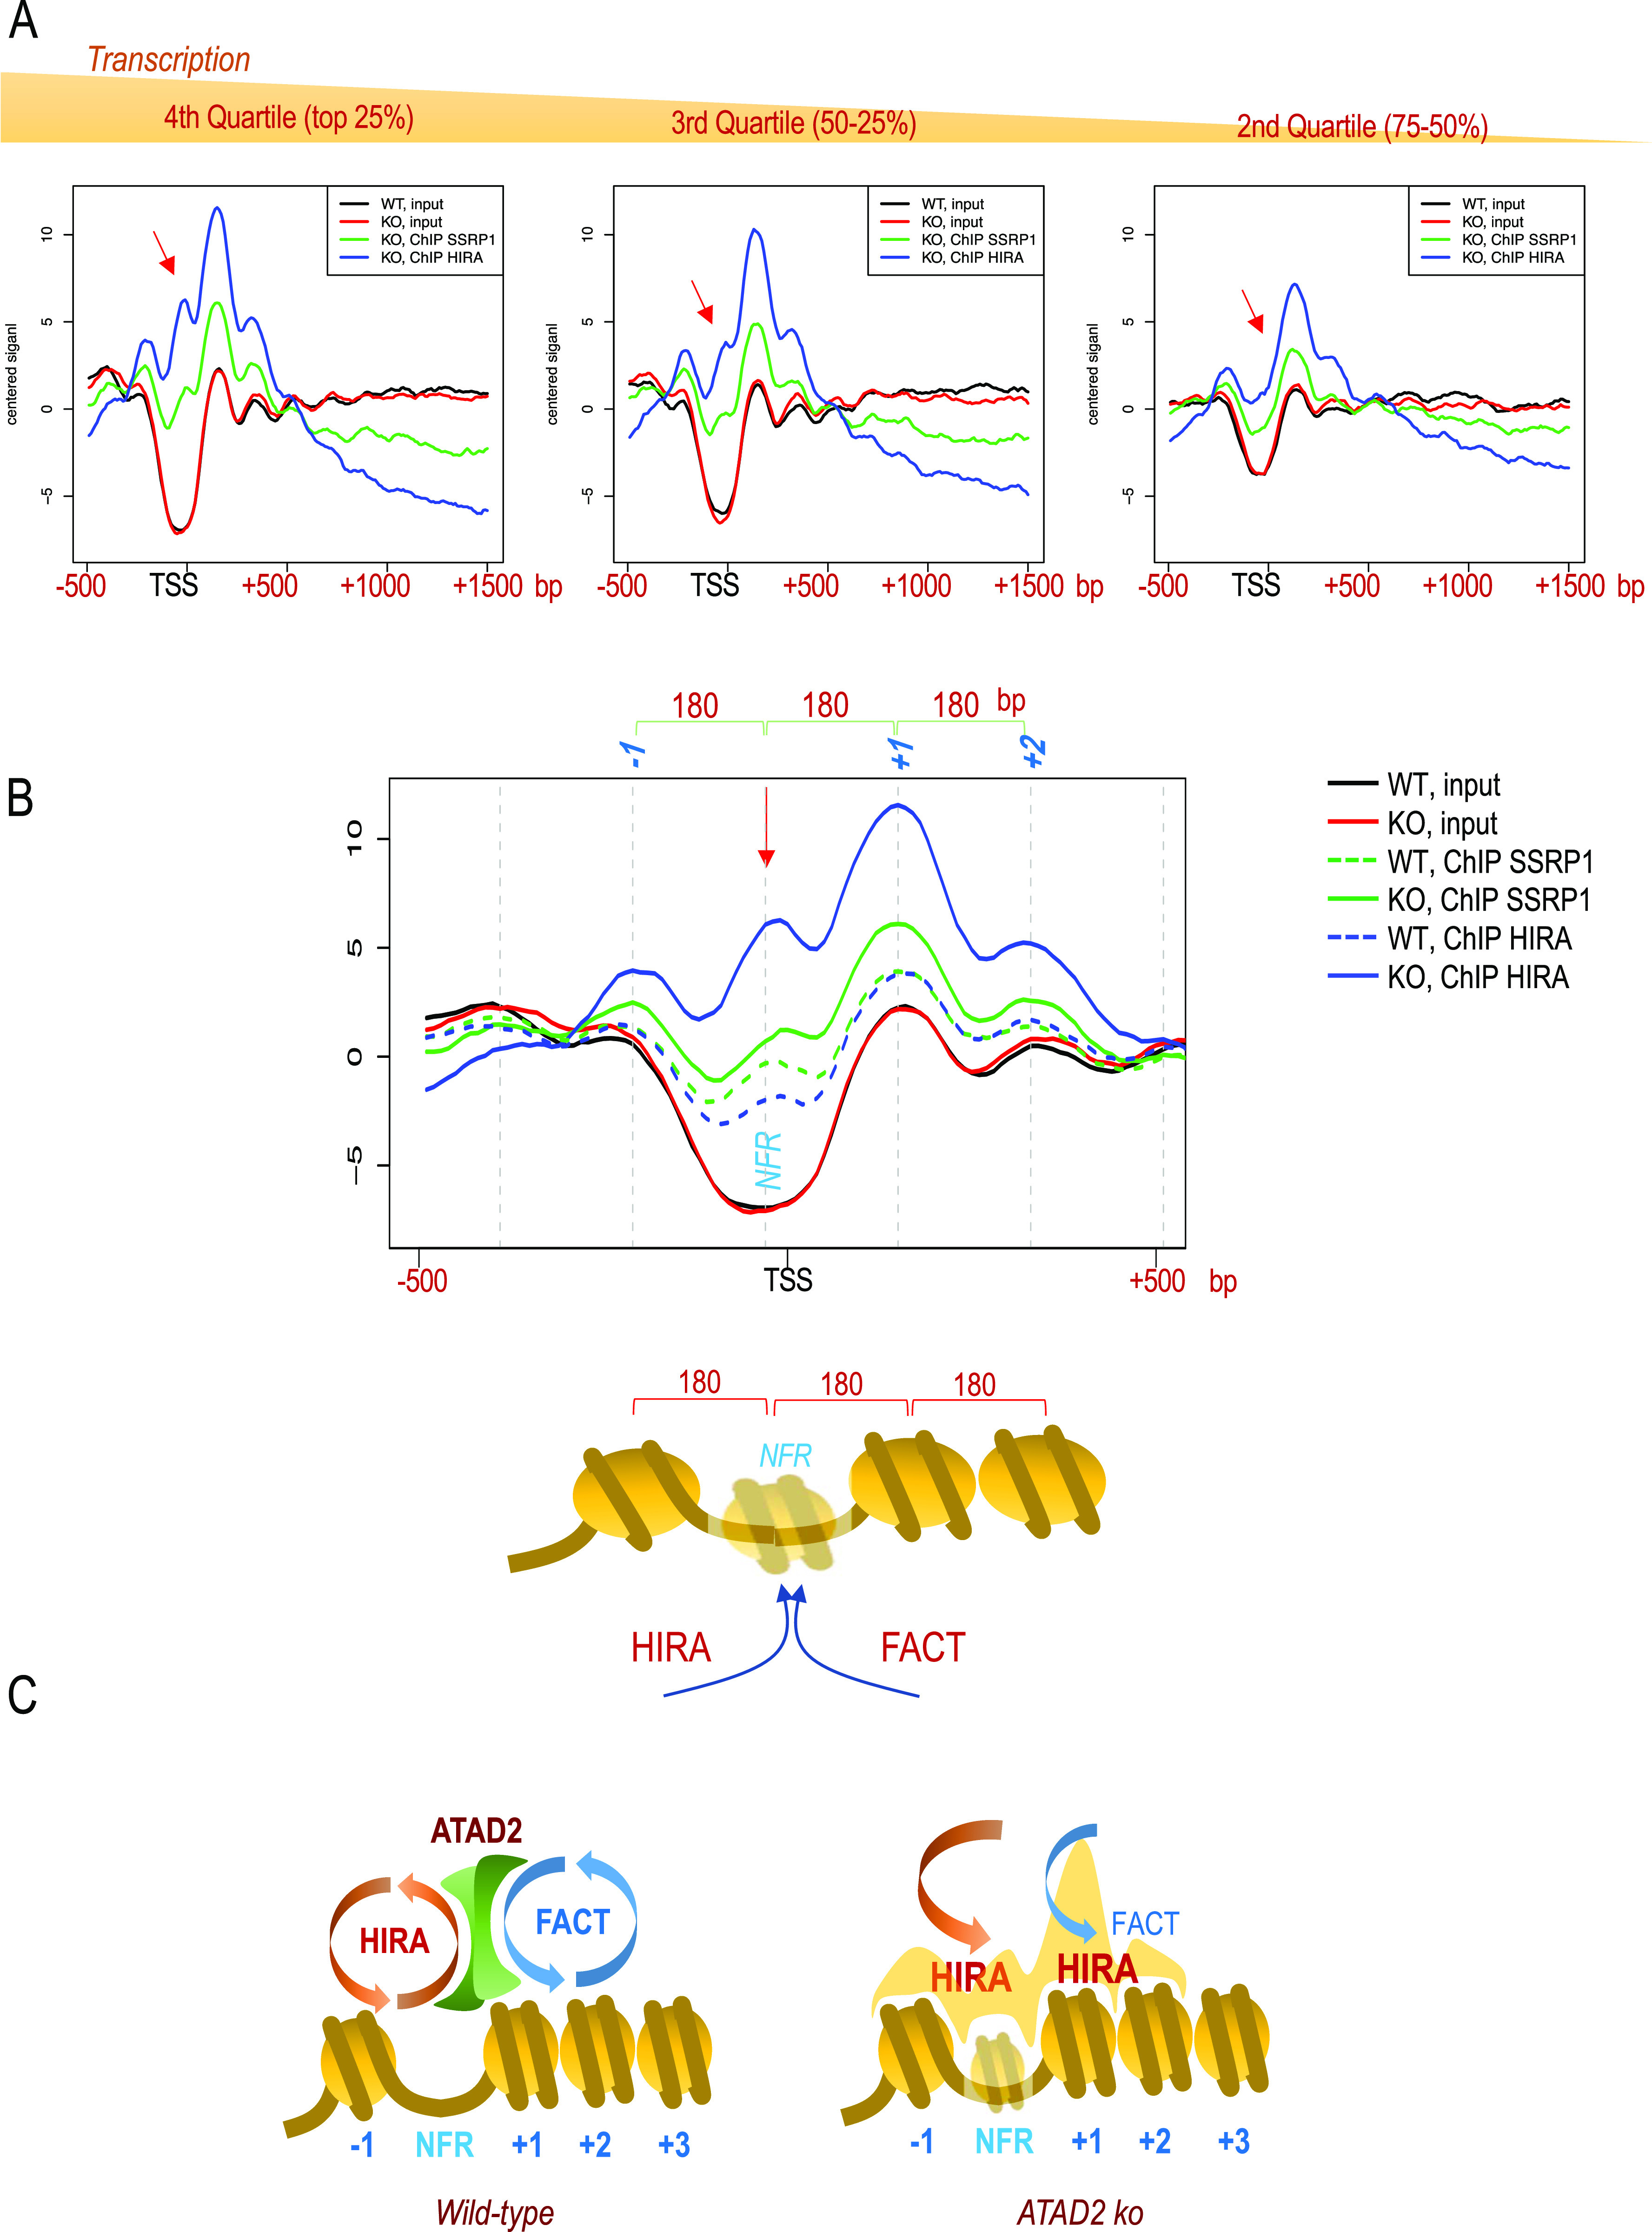
Figure 4. Atad2-dependent control of histone deposition by FACT and HIRA in embryonic stem cells.

(A) RPKM-normalized read coverage mean values over a region spanning from −500 to 1,500 bp with respect to the gene transcriptional start site (TSS) are shown for the input DNA (black line, wild type; red line, Atad2 KO). DNA co-immunoprecipitated with HIRA (blue line) and Ssrp1 (green line) from Atad2 KO embryonic stem cells are also shown over the input signal. For this analysis, the gene TSSs were grouped into quartiles as a function of gene transcriptional activity calculated from our own RNA-seq data (Morozumi et al, 2016), and the TSS corresponding to the top (fourth quartile) most expressed genes, third quartile (mid-expression) and second quartile (low expression) are shown separately from left to right. The red arrow indicates the peak of read coverage value present at the HIRA-bound nucleosome-free region (NFR) region of highly active genes, which disappears on the NFRs of the less active gene TSSs. (B) Input and ChIP read signals shown in panel (A) for the top 25% active genes are shown at higher resolution to visualize the distance separating neighbouring nucleosomes from dyad to dyad. A schematic representation of the nucleosomal organization over gene TSSs is shown below. (C) Models summarizing the ChIP-seq mapping data of nucleosome distribution and HIRA and FACT localization in wild-type and Atad2 KO active gene TSSs are shown. In wild-type cells, Atad2 ensures a dynamic interaction of HIRA and FACT with chromatin at the gene TSSs, maintaining an equilibrium between histone deposition and removal. In Atad2 KO cells the residence time of HIRA and FACT on nucleosomes is significantly increased, especially on the NFR region.
