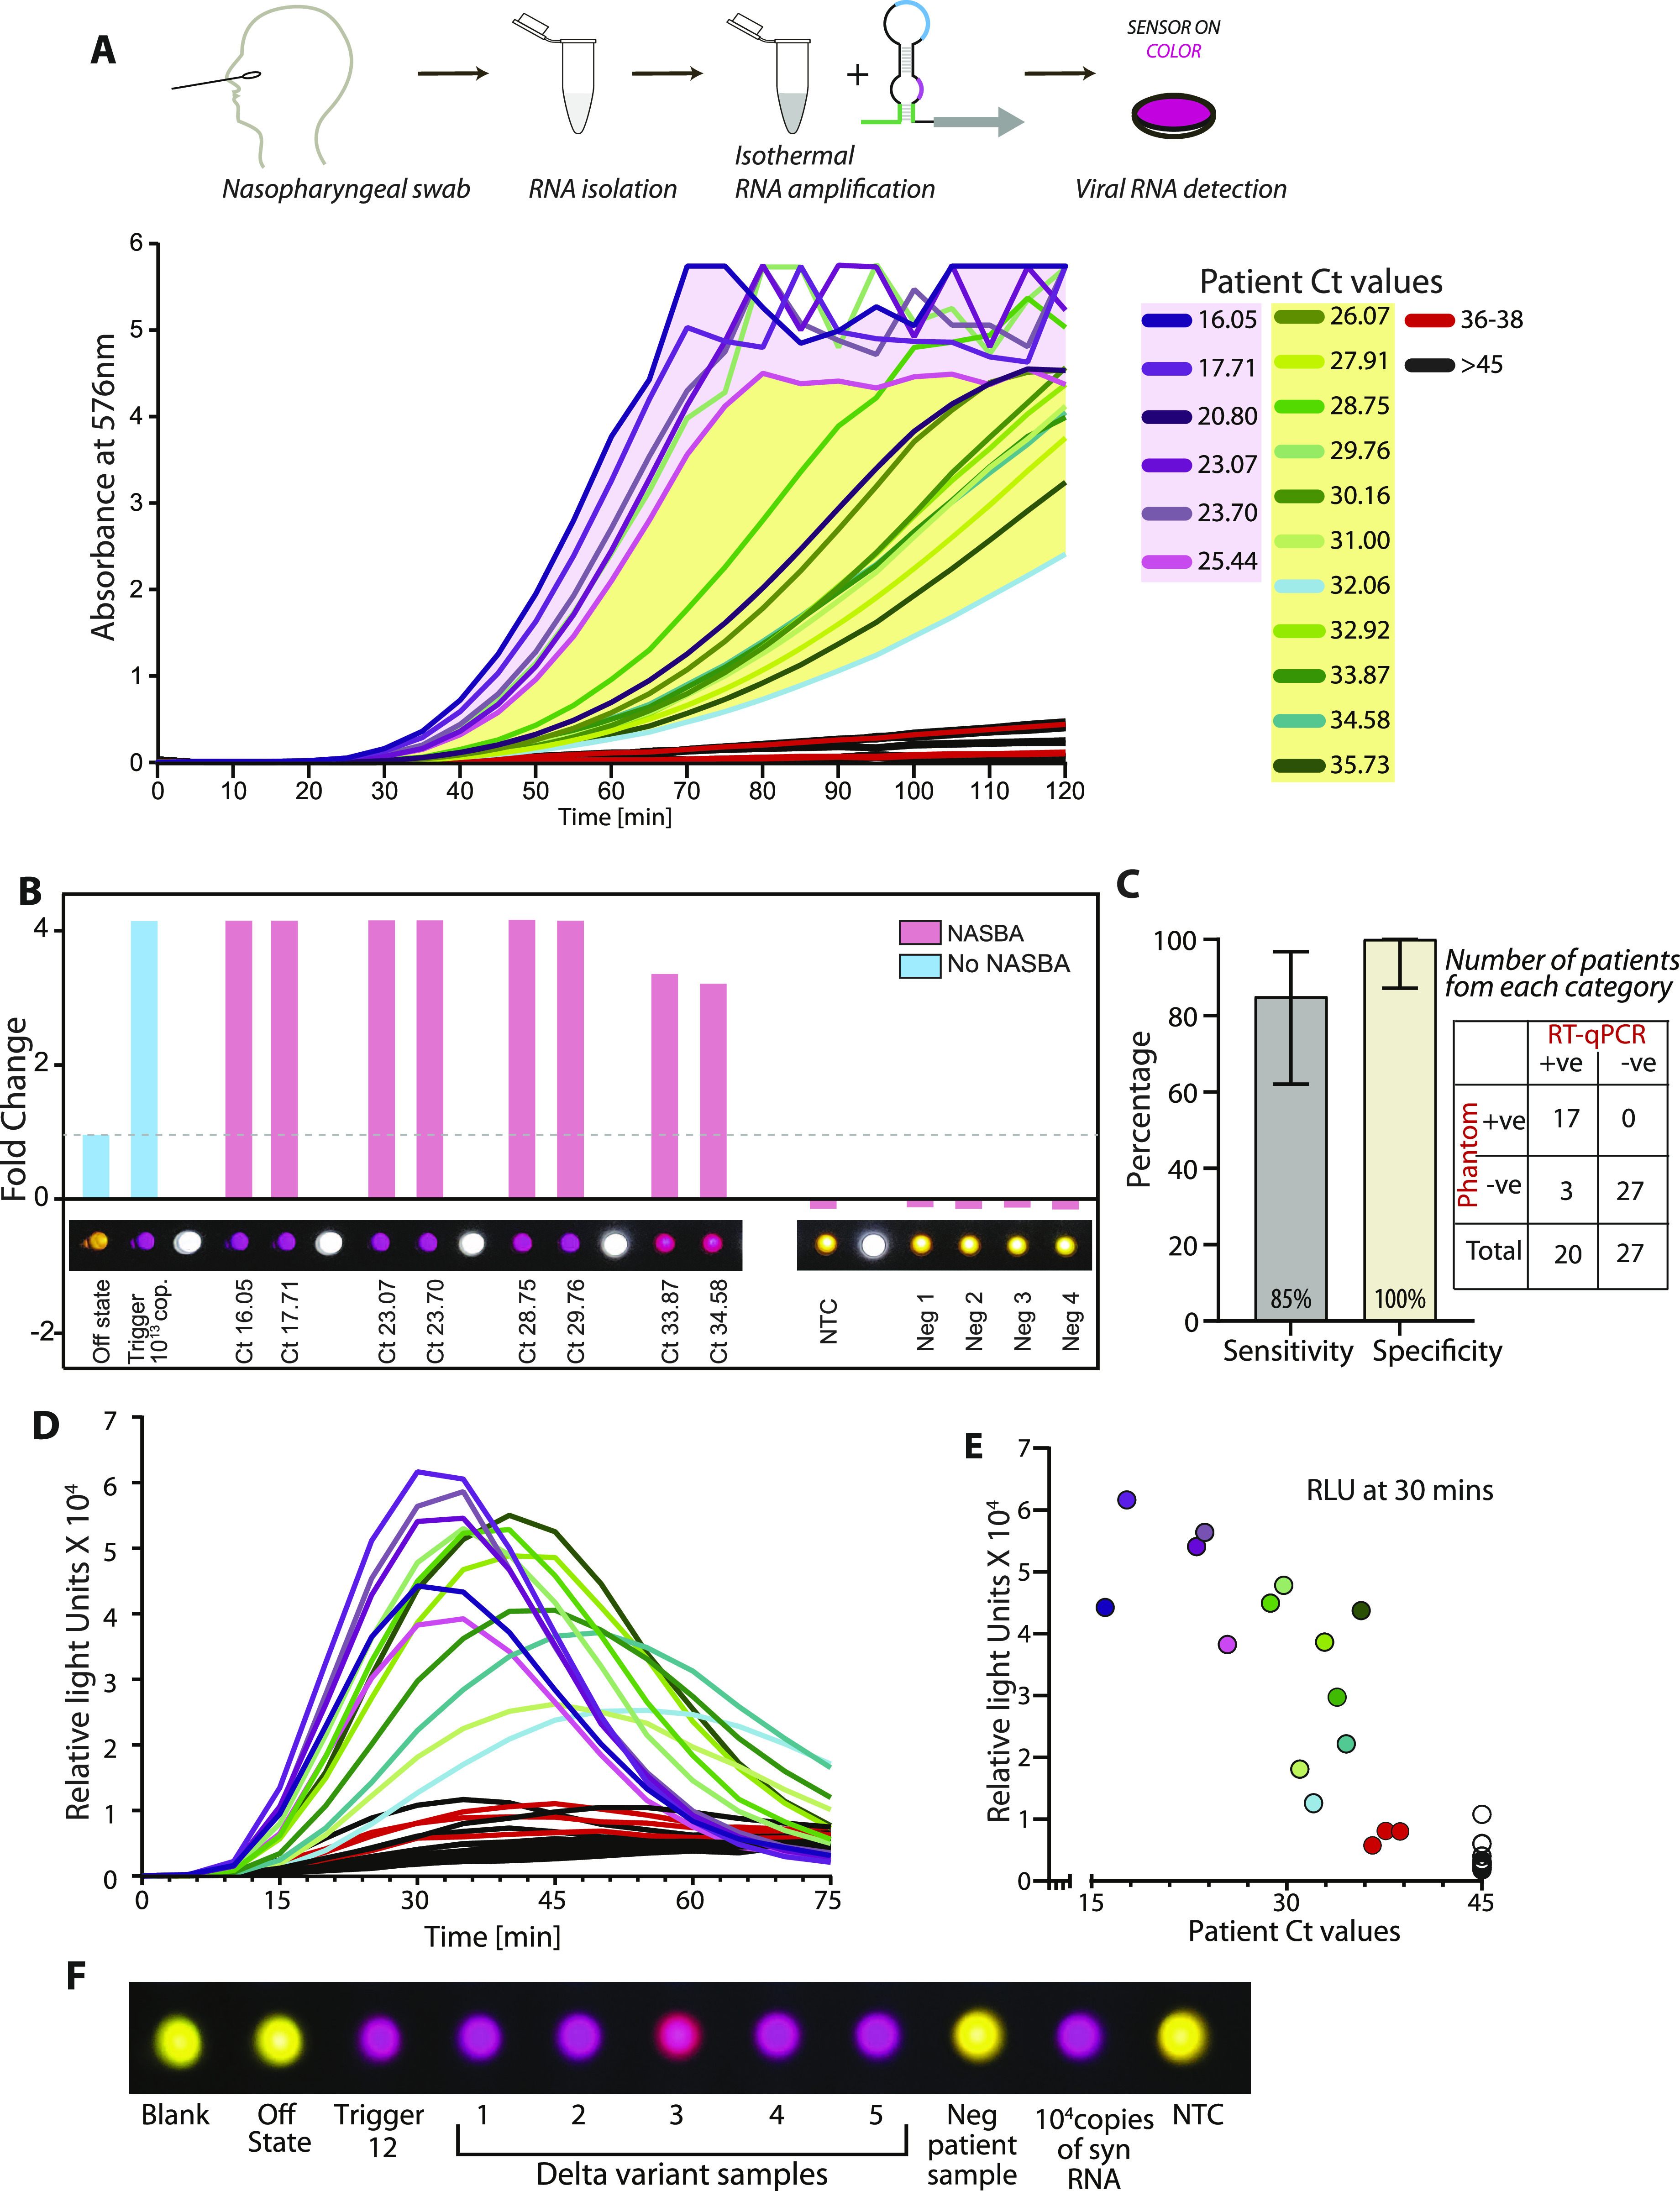
Figure 5. Sensitive and specific detection of SARS-CoV-2 RNA in human patient samples.
(A) NASBA coupled with in vitro transcription–translation (IVTT) assay performed on RNA extracted from nasopharyngeal swab samples. Samples had already been tested for the presence of SARS-CoV-2 RNA using standard real-time RT-PCR test and designated negative or positive (with accompanying Ct values shown here). Sensor 12 fused to lacZ was used for IVTT. Shown are absorbance (576 nm) values over time. Samples are color coded based on their designation and Ct values; Ct values 16–25.4 (purple), Ct values 26–35.7 (green), Ct values 36–38 (red), and negative patients with Ct values > 45 (black). Caption indicates Ct values corresponding to individual curves. (B) Photo from a basic cell phone camera showing color readouts of IVTT assay from patient samples. Assay (as described in (A)) performed in plate format. Bar graph shows quantitation of individual wells showing color readouts from selected patient samples. A cell phone camera image can be used to distinguish COVID-19 positive from negative samples. (C) 20 COVID-19 positive and 27 negative samples as determined by RT-qPCR, were tested using our PHANTOM assay (contingency table). Sensitivity is calculated as the ratio of number of positives identified by our assay to the total number of RT-qPCR–positive samples tested. Specificity is calculated as the ratio of number of negatives identified by our assay to the total number of RT-qPCR–negative samples tested. Error bars represent 95% confidence interval calculated using the Exact Clopper Pearson method. (D) Luminescence read-out for patient samples. Sensor 12 fused Nano-lantern is used for IVTT assay. Shown are luminescence intensities for patient samples over time. Color coding of samples same as above. (E) Luminescence intensity at 30 min of the IVTT assay (post-NASBA amplification) versus Ct-value for patient samples. Ct values were determined through the standard real-time RT-PCR test. Assay read-out clearly discriminates samples positive for viral RNA from negative samples. (F) Photo from a cell phone camera showing color readouts of IVTT assay from δ variant (B.1.617.2) patient samples. Time course measurements are shown in Fig S7.
Source data are available for this figure.

