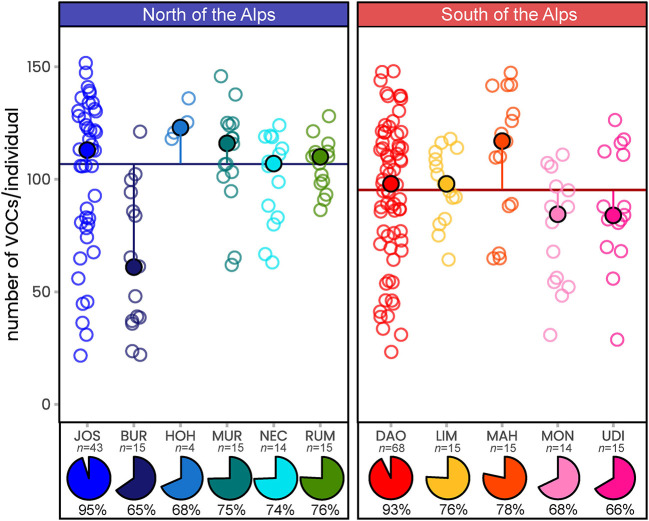
Figure 2.
The number of floral scent compounds recorded in Arum maculatum individuals from populations north and south of the Alps. Filled circles denote the population median of the number of volatiles per individual; the vertical lines indicate the distance to the region median (horizontal line); open circles mark the number of volatiles detected in the individual samples. Pie charts indicate the percentage of volatiles detected per population (n, sample size) compared to the number of compounds detected across all samples (289 compounds). See Figure 1 and Supplementary Table 1 for identification of population codes.

