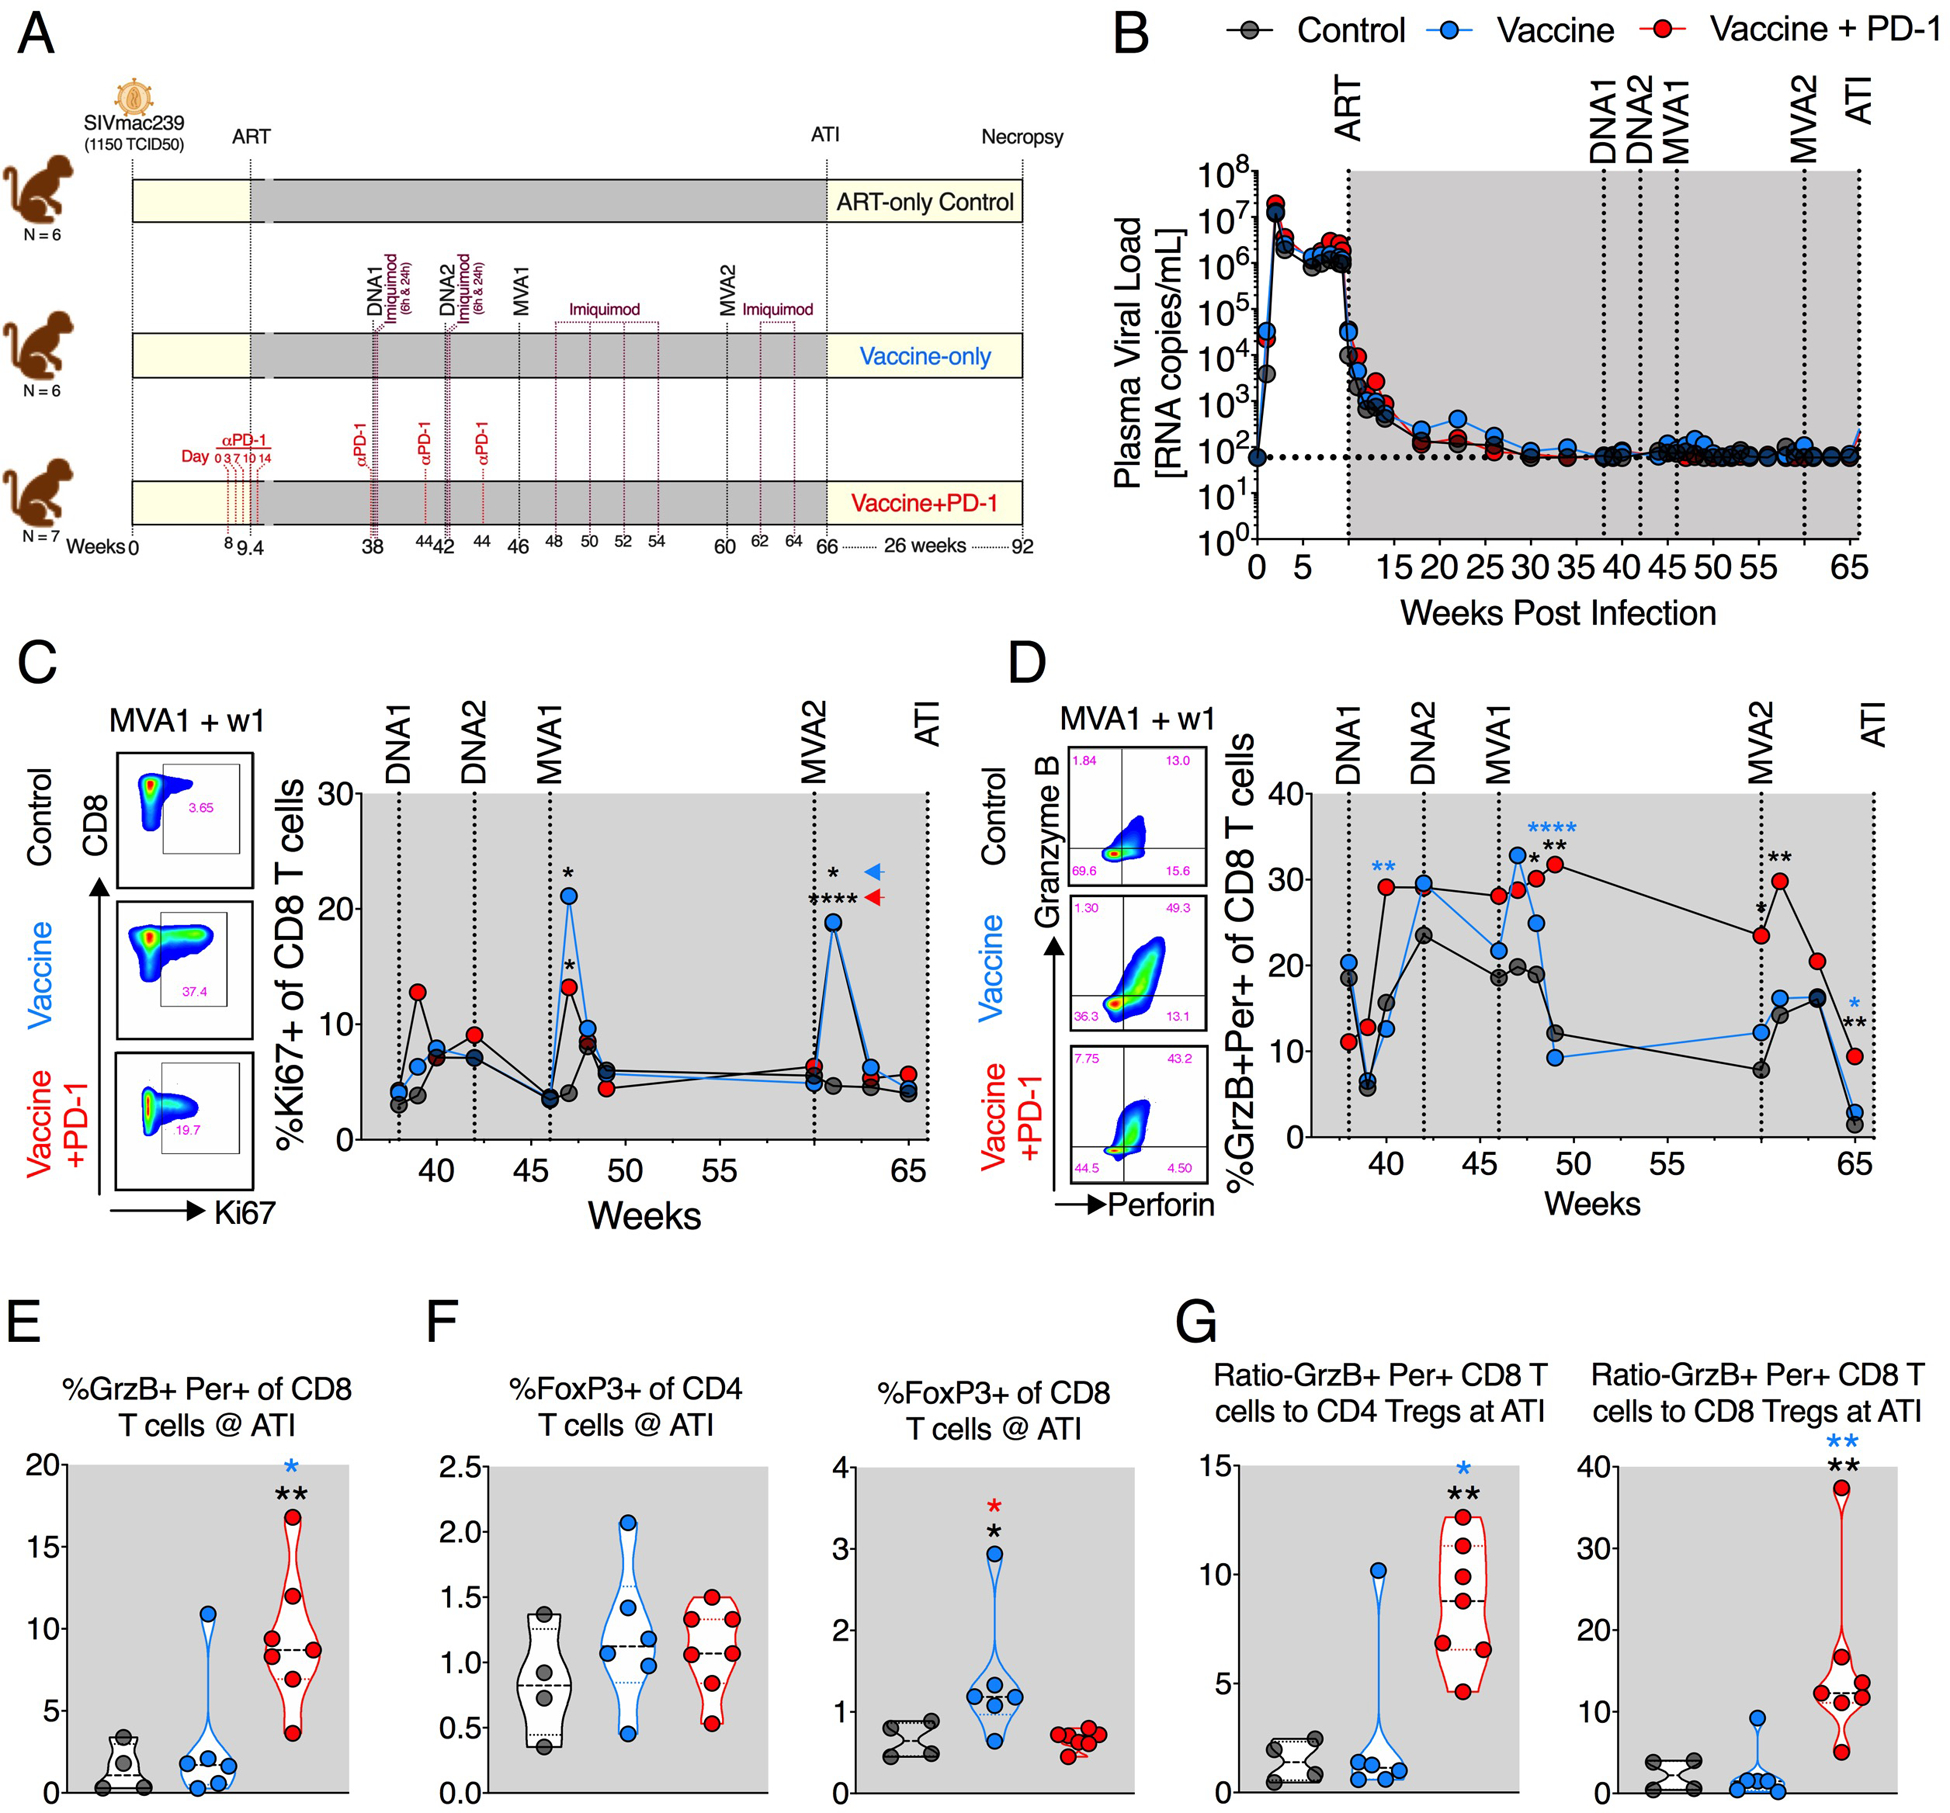
Fig. 1. PD-1 blockade combined with the DNA/MVA vaccination enhanced expression of cytolytic protein in CD8+ T cells.

(A) Schematic of the study design. (B) Viral suppression kinetics after infection and ART. Geometric mean values for each group are shown. (C and D) Frequency of proliferating (Ki67+) (C) and cytolytic (GrzB+ denoted as GrzB and perforin+ denoted as Per) (D) CD8+ T cells during the course of vaccination. (E) Cytolytic (GrzB+ Per+) CD8+ T cell frequencies at the time of ATI. (F) CD4+ and CD8+ Treg frequencies at ATI. (G) The ratio of Tregs and cytolytic CD8 T cells at ATI. The color of the significance star denotes the group to which comparison was made. Black/gray, blue, and red color refer to the control, vaccine, and vaccine + PD-1 groups, respectively. Colored arrowheads in (C) denote group to which significance star belongs. P value was calculated using Mann-Whitney test. W, weeks; ART, antiretroviral therapy; Per, perforin. *P ≤ 0.05; **P < 0.01; ****P < 0.0001.
