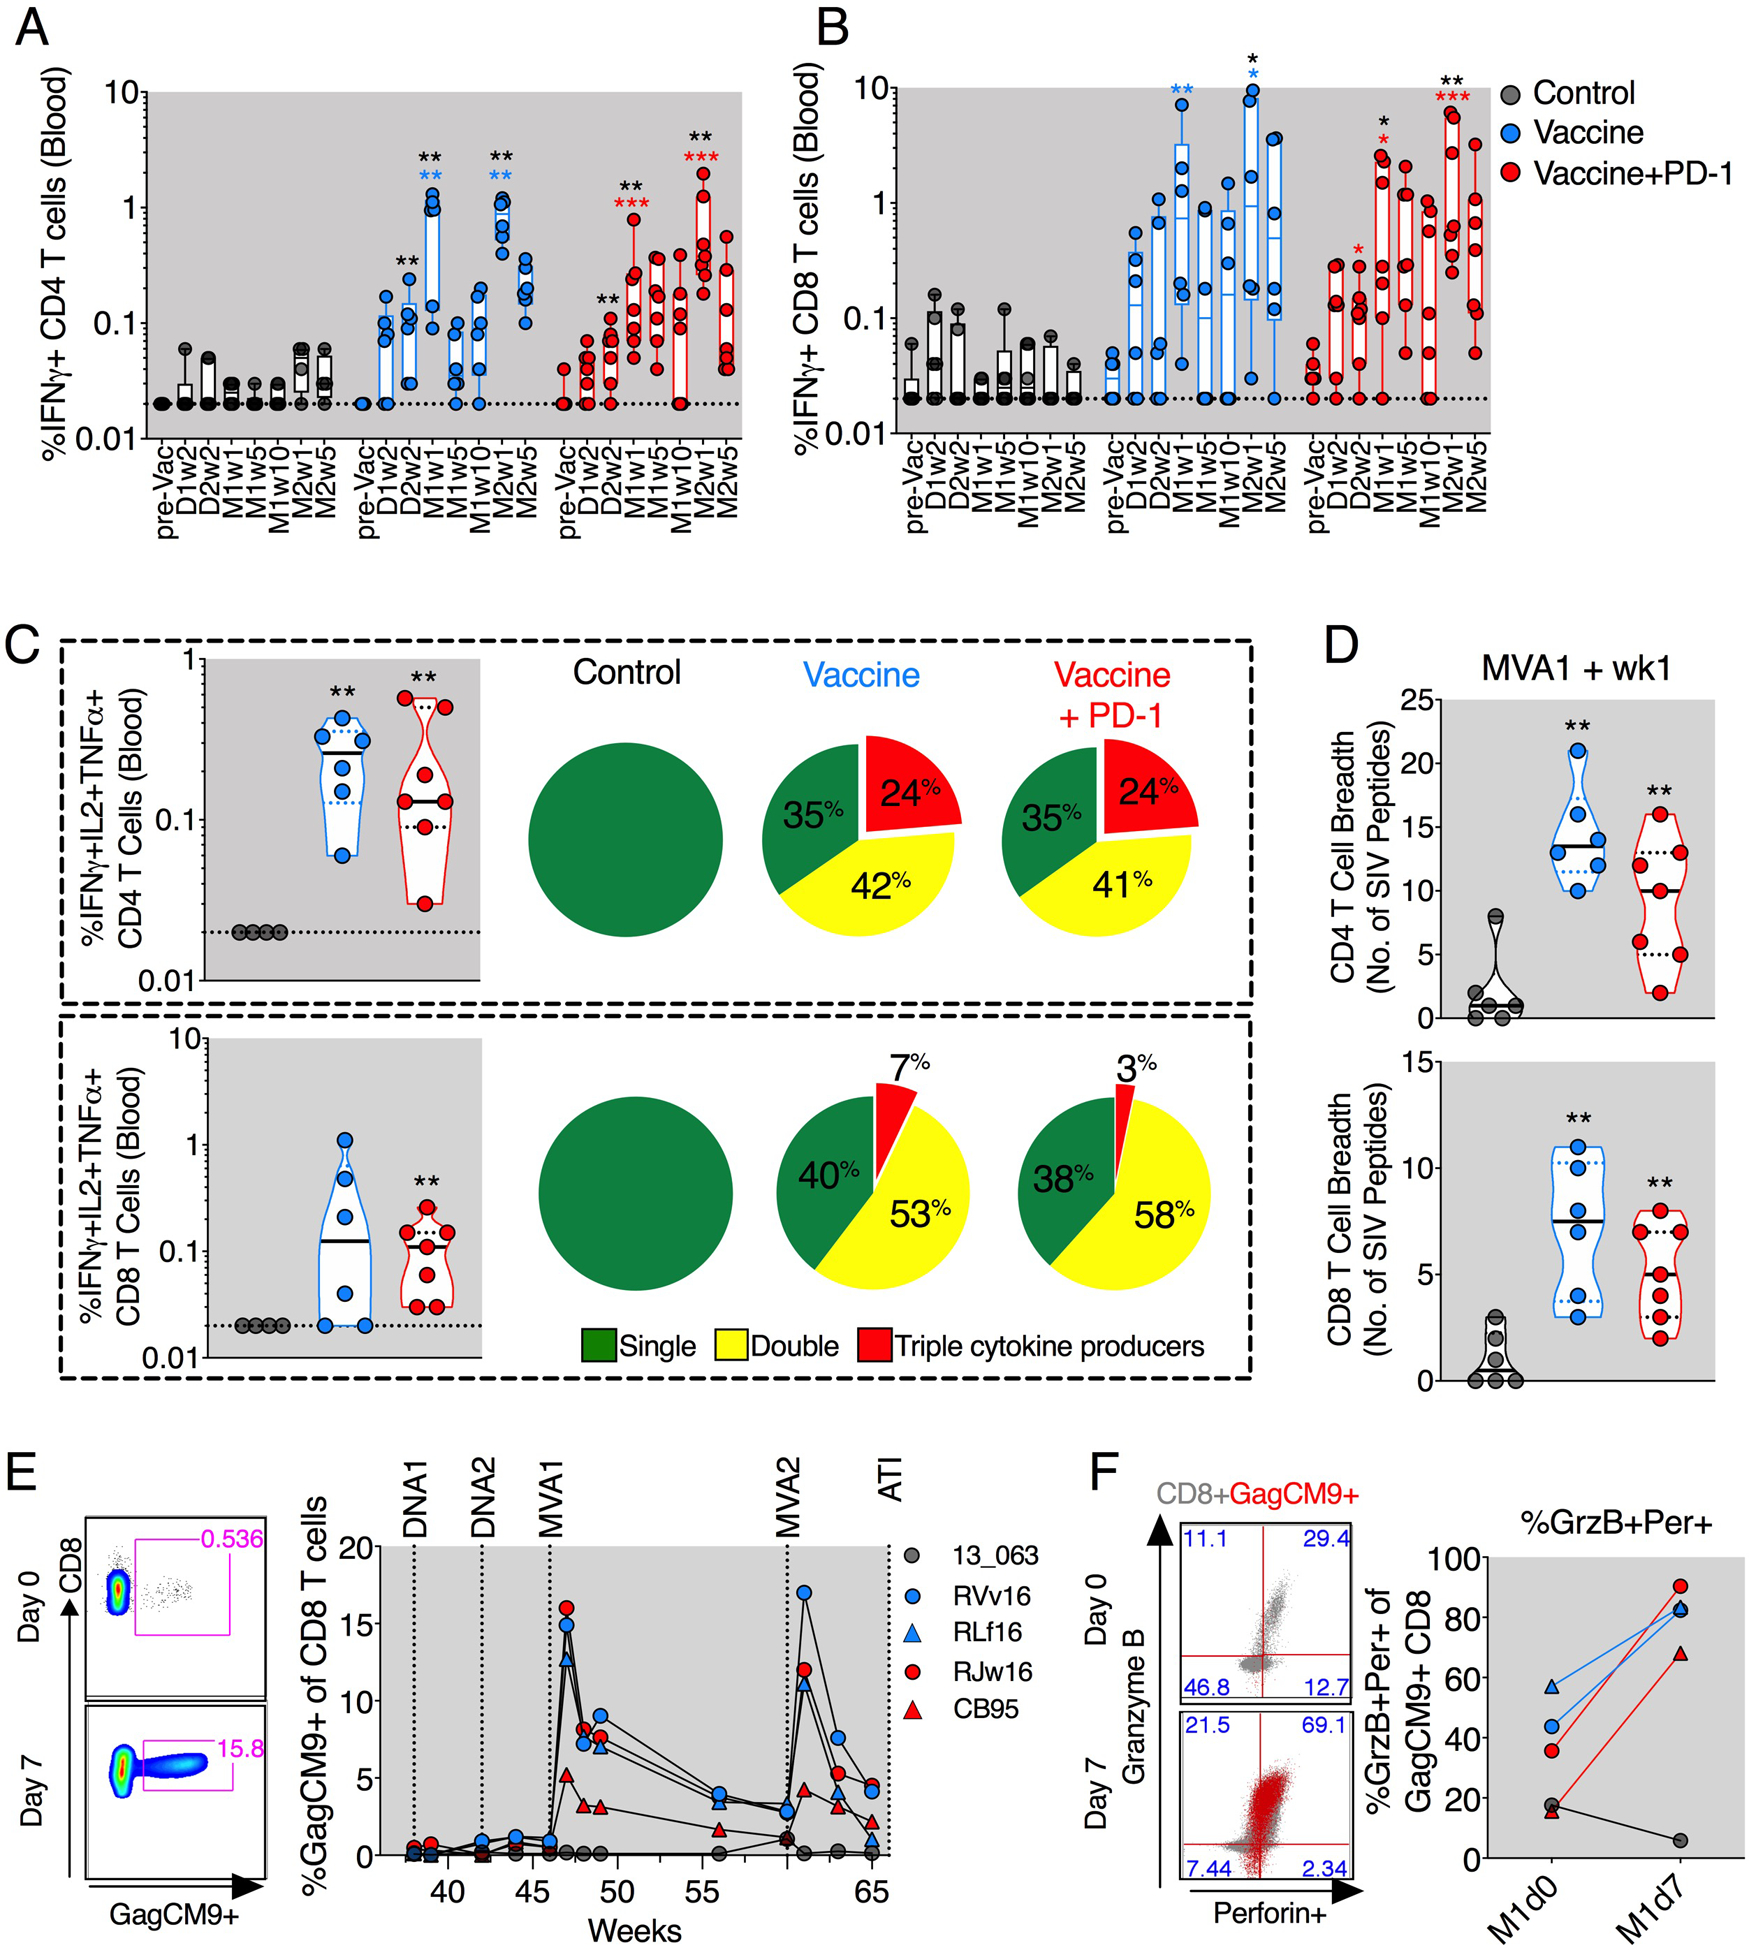
Fig. 2. DNA/MVA vaccination induced robust and highly functional SIV-specific CD4+ and CD8+ T cell responses in blood.

(A and B) Longitudinal analyses of SIV-specific IFNγ+ producing CD4+ (A) and CD8+ (B) T cells. (C) Frequency of triple cytokine (IFNγ+IL-2+TNFα+) producing T cells (scatter plots) and the proportion of T cells making single (IFNγ+ or IL-2+ or TNFα+), double (IFNγ+TNFα+/ IFNγ+IL-2+/IL-2+TNFα+), or triple (IFNγ+IL-2+TNFα+) cytokines in response to Gag and Env peptide stimulations (pie charts). (D) CD4+ and CD8+ T cell breadth defined by the number of SIV peptide minipools (Env and Gag) against which CD4+ and CD8+ T cells produced one or more IFNγ+/IL-2+/TNFα+ cytokines. (E) Frequency of SIV Gag-CM9 tetramer–specific CD8+ T cells. (F) Expression of GrzB and perforin on Gag-CM9 tetramer– specific CD8+ T cells before and after the first MVA boost. The color of the significance star denotes the group to which comparison was made. Black/gray, blue, and red color refer to the control, vaccine, and vaccine + PD-1 groups, respectively. P value was calculated using Mann-Whitney test. D, DNA; M, MVA; W, week; pre Vac, prevaccination. *P ≤ 0.05; **P < 0.01; ***P < 0.001.
