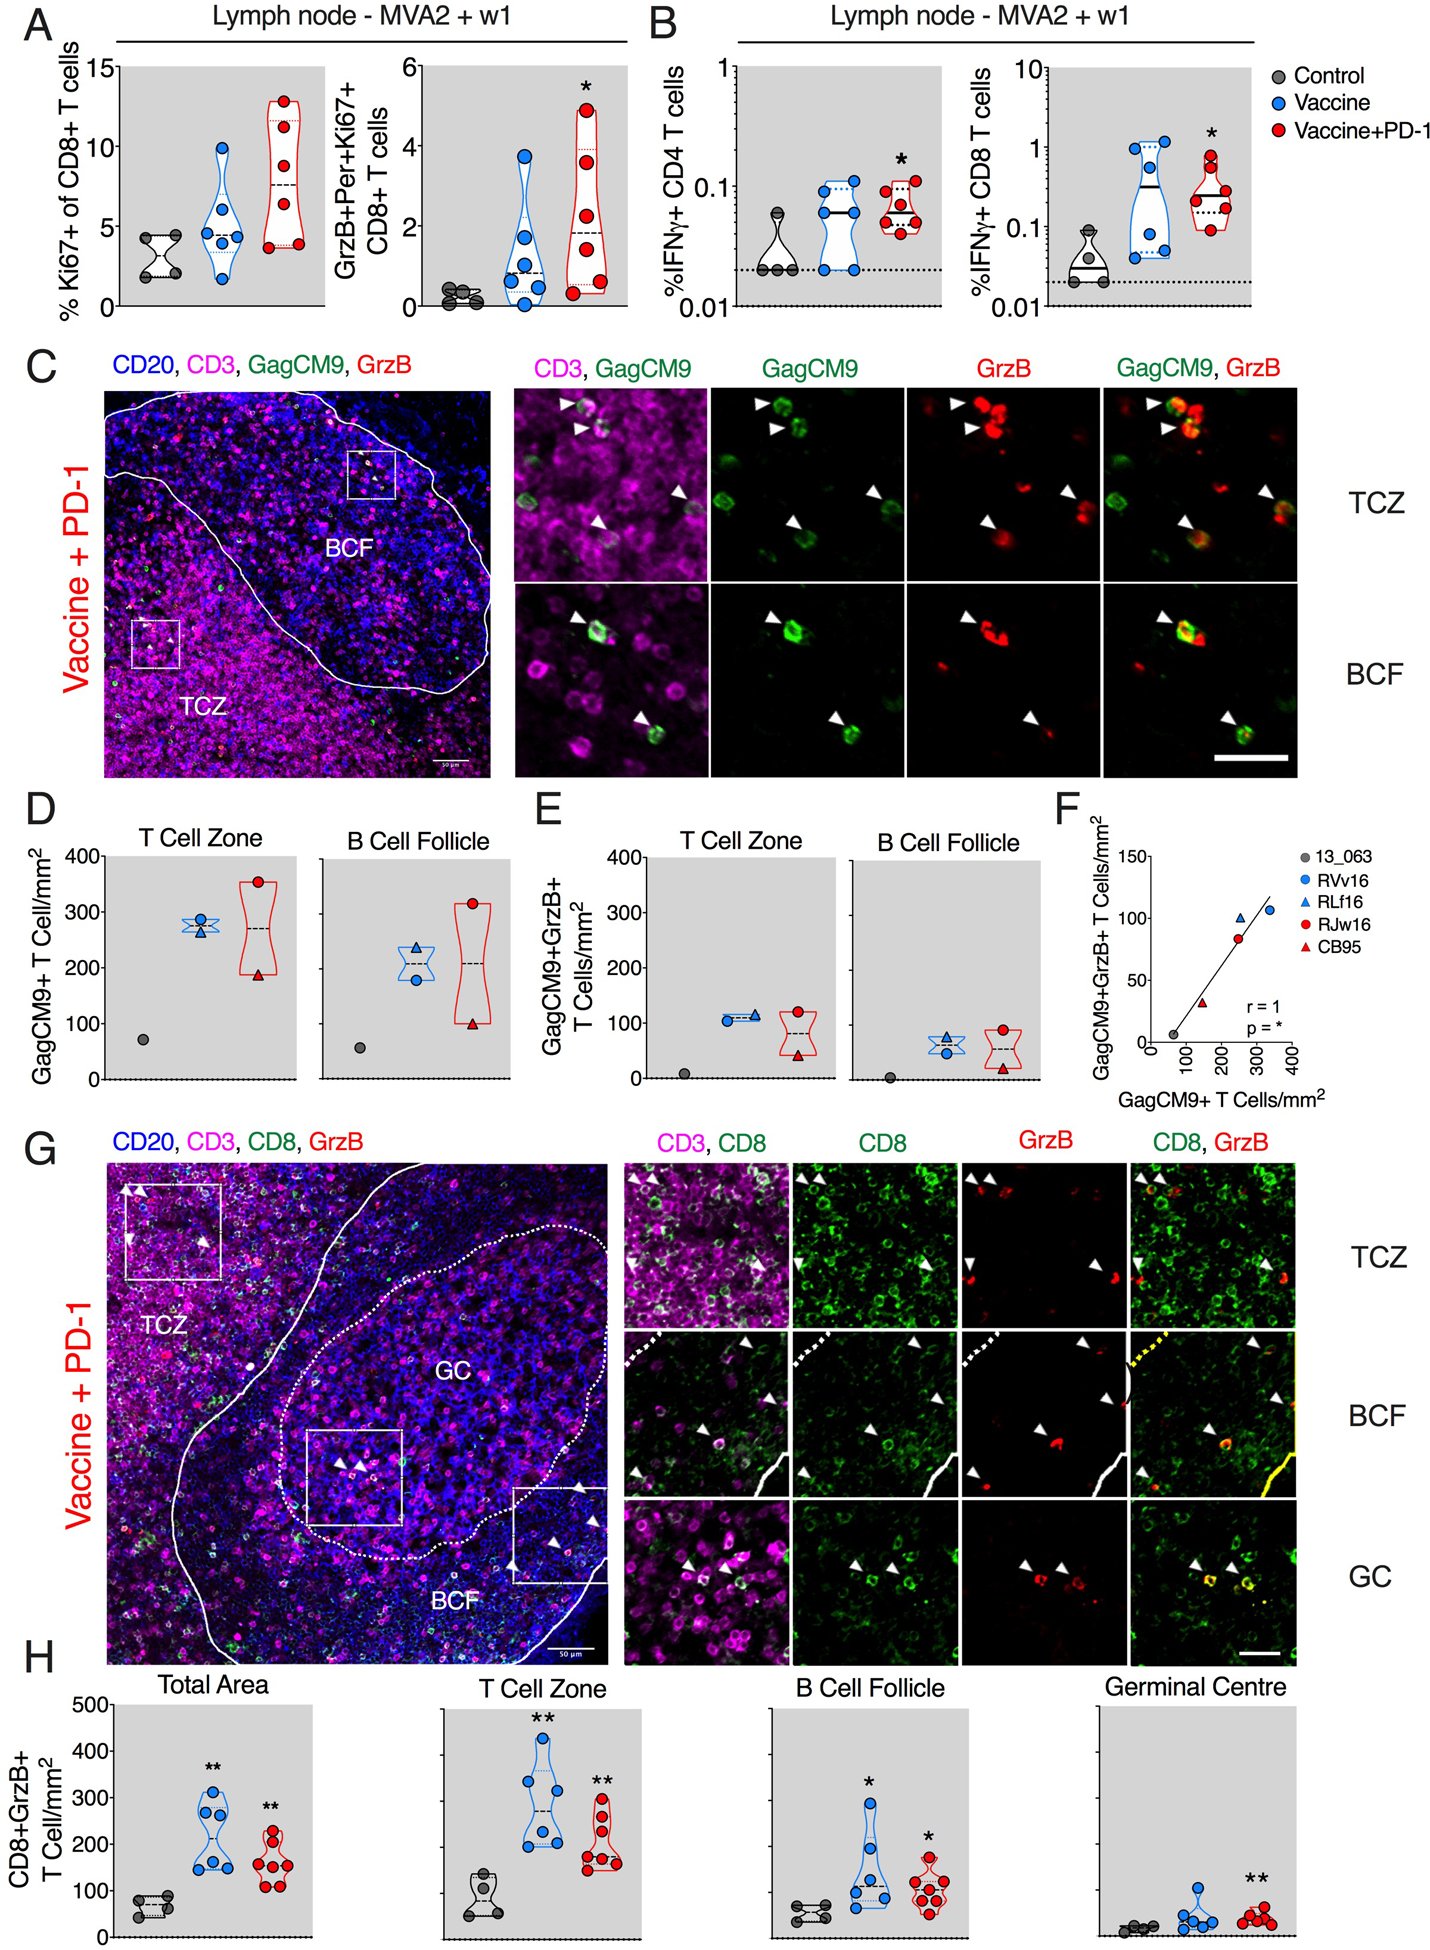
Fig. 3. DNA/MVA vaccination enhanced cytolytic CD8+ T cell localization in the LN.

(A) Frequencies of Ki67+ and GrzB+ Per+ Ki67+ CD8+ T cells. (B) SIV-specific IFNγ+ CD4+ and CD8+ T cell responses. (C to F) Quantification of total SIV Gag-CM9 tetramer–specific CD8+ T cells using in situ Gag-CM9 tetramer staining at week 1 of final MVA. Representative images from ~10 different regions of a LN section per animal (N = 2 for vaccine and vaccine + PD-1 groups and 1 for ART-only control group). (C) Summary of data for total GagCM9 tetramer+ (D) and for tetramer+ GrzB+ cells (E). (F) Spearman correlation between total GagCM9+T cell and GagCM9+GrzB+ T cell density. (G and H) Quantification of total CD8+ T cells coexpressing GrzB using immunohistochemistry. Representative image from ~10 different regions of a LN section per animal (N = 6 for vaccine and ART-only control groups and 7 for vaccine + PD-1 group) (G) and summary of data for all animals (H). The inset (white square) shows the representative region picked to show zoomed images on the right. The color of the significance star denotes the group to which comparison was made. Black/gray, blue, and red color refer to the control, vaccine, and vaccine + PD-1 groups, respectively. P value was calculated using Mann-Whitney test. *P < 0.05; **P < 0.01. Scale bar, 25 μm.
